1 Introduction
In recent years the definition of cycling has been challenged by the arrival of electrically assisted bicycles or e-bikes (also known as pedelecs).1 E-bike sales have grown tremendously in the last decade (Fishman & Cherry, 2016). They now represent one in four bicycles sold in Switzerland (Velosuisse, 2022),2 and half in the Netherlands (RAI & BOVAG, 2022). In the near future, they could exceed conventional bicycle sales. The potential of e-bikes lies in their ability to expand the boundaries of cycling as a practice (Behrendt, 2018). Thanks to their pedal assistance, e-bikes make cycling easier and attract population categories underrepresented in low-cycling contexts, such as women and mature or older adults, providing independence and physical activity benefits (Van Cauwenberg, de Geus, et al., 2018). E-bikes also enable a lifelong engagement with cycling by allowing people to return to cycling or maintain it despite limitations due to old age, health, or personal circumstances (Marincek & Rérat, 2021). Through their increased spatial reach and ability to tackle hilly terrain, they could expand utilitarian cycling to suburban or rural areas (Rérat, 2021b). E-bikes can play an important role in a transition towards sustainable mobility, by replacing trips which would have been conducted by car (Hiselius & Svensson, 2017). However, to develop e-bikes to their full potential, the barriers which restrict their use need to be addressed.
Cycling safety is considered as one of the main barriers preventing people from cycling (Winters et al., 2011; Daley & Rissel, 2011). In low-cycling contexts, unsafe cycling conditions contribute to the “fear-based exclusion” of potential cyclists (Chataway et al., 2014). Perceived safety affects not only cyclists’ decision to cycle, but also, their route choice, on-road behaviour and positioning (Manton et al., 2016). Cycling safety can traditionally be divided into “objective safety”, or bicycle crashes,3 and “subjective” or perceived safety (Chaurand & Delhomme, 2013). However, in recent years, scholars have argued that focusing on crashes vastly underestimates the problem of cycling safety. Crashes represent just the “tip of the iceberg” of cycling safety, and only a minority are actually reported4 (Juhra et al., 2012; Shinar et al., 2018). Recent research has moved beyond crashes to emphasize the importance of perceived safety, which represents a collection of cyclists’ experiences and representations which are not captured by official statistics. This includes dangerous situations or near-misses such as “close passes” by motor vehicles, “dooring”, “hooking” and blocking manoeuvres, which happen much more often than crashes and have a stronger influence on how cyclists perceive safety (Aldred, 2016; Sanders, 2015). It also includes a general feeling of safety related to the social representation of cycling (e.g. as a dangerous practice), which affects the whole population (Horton, 2007; Ravensbergen et al., 2020).
To date, most research on e-bike safety has focused on crashes, a recurring question being whether they have a higher crash risk than conventional bicycles (Schepers et al., 2014).5 However, few research has considered e-bike users’ perceived safety, much less in different traffic environments. This research gap may be explained by e-bikes’ recent diffusion, but also, by the assumption that e-bike users’ experiences are largely similarly to those of conventional cyclists. However, qualitative findings suggest that the electrical assistance leads to a different experience of cycling safety and changes the relationship to cycling infrastructure and other road users. When cycling on the road, e-bikers have reported feeling safer and more confident than with conventional bicycles due to their ability to keep up with the flow of motor traffic and accelerate more quickly from a stop or traffic light (Jones et al., 2016; Popovich et al., 2014). Conversely, e-bikers have said they feel unsafe when approaching intersections because they fear motorists might underestimate their speed (Jones et al., 2016; Popovich et al., 2014), leading to potential crashes (Petzoldt et al., 2017).
Although it would be expected that e-bikers have higher perceived safety than conventional cyclists, a comparison of commuters by e-bike and conventional cycling found the former were less at ease in most traffic situations (Rérat, 2021b). This may be due to the specific demographics of e-bike users. E-bikes attract older adults, returning cyclists, young parents with children, or higher proportions of women, who could be more sensitive to safety conditions. To date, only one study has considered differences among e-bike users for perceived safety. In Denmark, Haustein & Møller (2016b) found that higher perceived safety was related to being male, being excited by e-bike use, having the same riding style as on a conventional bike, and having greater e-bike experience, while being female, older than 60, and cycling regularly on longer daily distances was related to lower perceived safety. Still, more research is needed to understand how different e-bike users perceive safety in a variety of situations.
To account for a diversity of e-bike users and develop policies to target their specific needs, segmentations of cyclists are a useful tool (for a review, see Felix et al., 2017). Cyclists can be grouped based on a variety of factors, including frequency and purpose of cycling (Heinen et al., 2011), motivations for cycling (Gatersleben & Haddad, 2010), or infrastructure preferences, which are related to perceived safety (Damant-Sirois et al., 2014). Most famously, Geller (2006) and subsequent studies by Dill & McNeil (2013, 2016) segmented cyclists and non-cyclists in the population into 4 groups depending on their interest for cycling, their level of comfort in different types of infrastructure, and their frequency of cycling.6 They identified the largest part of the population as safety-conscious, willing to cycle if physically separated cycle paths were offered. In e-bike literature, only one segmentation has been proposed by Haustein & Møller (2016a), who categorized e-bike users in Denmark based on their attitudes to e-biking as either enthusiastic (wishing to cycle more), utilitarian (already cycling regularly), and recreational (cycling for recreation). However, no studies have attempted to segment e-bike users based on their perceived safety. This limits our understanding of the needs of different e-bike users, and our ability to formulate policies and adapt existing cycling infrastructure.
This paper fills a gap in e-bike literature by focusing on perceived safety in different traffic situations and proposing a segmentation of e-bike users. It asks the following questions: (1) How do e-bike users perceive safety in different situations, and depending on their personal characteristics, and (2) how can e-bike users be segmented into groups based on their perceived safety? To this end, we use data collected from a survey among 1466 e-bike users in the city of Lausanne, Switzerland. Perceived safety is measured through a series of 13 statements, which are reduced to three components. Based on the latter, a segmentation of four groups of e-bike users is proposed, and each group’s characteristics are investigated using logistic regression models.
The remainder of the paper is structured as follows. In the next section, we propose a theoretical framework which serves to analyse the factors affecting perceived safety at the individual and territorial level. In the methods section, we present our survey, variables, context, and analysis. Our results include a description of the profile of e-bike users, of the variables used to measure perceived safety, and of the differences between the four groups of e-bike users. The discussion compares our results to the literature. Lastly, the conclusion offers some policy recommendations for increasing e-bikers’ perceived safety.
2 Theoretical framework
2.1 Vélomobility and safety
Perceived safety includes both a cognitive dimension – the perceived probability of being involved in a cycling crash in a given situation – and an emotional dimension – the fear of being injured or killed (Møller & Hels, 2008; Slovic et al., 2004). Although not all crashes are collisions with cars, cyclists’ fear is mainly imposed upon them by the presence of motor traffic (Jacobsen et al., 2009). This includes the fear of cycling with a lack of bicycle facilities to escape from motor traffic, of drivers’ dangerous or inattentive behaviour, of slipping or falling on the road, and of being harassed or shamed (Winters et al., 2011). Social scientists have argued that this “fear of cycling” is related to the wider stigmatization of cyclists as a minority in automobile-centred societies (Horton, 2007; Prati et al., 2017).
In low-cycling countries, cycling often takes place within a context which is adapted to the dominant mode of transport, the automobile. Transport-oriented approaches, which focus on the individual’s decision to cycle, have been criticized for minimizing the role of the spatial context, and failing to explain why people do not cycle more (Spotswood et al., 2015). The concept of “vélomobility”, has been used to describe the system which supports the practice of cycling (Watson, 2013; Koglin & Rye, 2014; Cox, 2019), or in the case of e-biking, e-vélomobility (Behrendt, 2018). This system can be further defined as the relationship between, on one hand, individuals with a potential for cycling, and on the other hand, a territorial context with a hosting potential for the practice of cycling (Kaufmann, 2011; Rérat, 2021b), or bikeability (Lowry et al., 2012). Within this framework, we consider cycling safety as a “friction” (Cresswell, 2010) resulting from these two clashing potentials, which can slow cycling down or stop it entirely. To analyse perceived cycling safety, it is therefore necessary to consider both a territory’s bikeability, and the individual’s cycling potential.
2.1.1 Bikeability and safety
Perceived safety reflects the individual’s relationship to a territory’s hosting potential, which can be measured at the level of the street (bicycle suitability), of the cycle network (bikeability), and of the community (bicycle friendliness) (Lowry et al., 2012). Cycling safety is affected by the spatial context (traffic conditions), the cycling infrastructure, and the norms or the social context around cycling (e.g. cycling as normal or dangerous) (Kaufmann, 2011; Rérat, 2021b).
Within the spatial context, traffic conditions and road characteristics strongly affect perceived safety. The speed and volume of motor traffic, width of a street, number of lanes, or presence of parked cars have a negative effect on cyclists’ perceived safety (Parkin et al., 2007; Manton et al., 2016). Beyond interactions with motor vehicles, external conditions related to weather (snow, rain), road surfaces (slippery surfaces, debris) and low visibility decrease perceived safety (Winters et al., 2011; Kummeneje et al., 2019).
The presence of cycling infrastructure, its width and level of separation from traffic improves perceived safety compared to cycling on the road (von Stülpnagel & Binnig, 2022). However, cycle lanes which provide only visual separation are less effective at improving perceived safety for infrequent cyclists than off-street bike paths or tracks which are physically separated from motor vehicles (Manton et al., 2016; Wang & Akar, 2018a). Intersections which are unregulated by traffic signals and rely on priority rules like roundabouts decrease perceived safety, as well as larger or more complex intersections with many exits requiring more attention from car drivers (Wang & Akar, 2018b; Von Stülpnagel & Lucas, 2020).
The social context of cycling, or “cycling culture” (Aldred & Jungnickel, 2014) also influences how individuals perceive cycling safety. In cities where most people cycle, it is considered a safe practice, whereas in low-cycling countries, it is perceived as a dangerous, masculine, minority practice (Chataway et al., 2014; Haustein et al., 2020).
2.1.2 Individual cycling potential and safety
In addition to the possibilities offered by the territory, perceived safety depends on the individual’s own cycling potential, which includes the following dimensions: access to a bicycle/e-bike or the physical capacity to cycle (“can”), skills or acquired abilities (“know”), and appropriation or choosing to cycle for trips (“want”) (Kaufmann, 2011; Rérat, 2021b). In the case of cycling safety, access includes personal characteristics (age, gender), while skills are linked to cycling experience, and appropriation is related to cycling frequency.
Gender has a strong influence on perceived cycling safety. Across studies, women tend to show a systematic preference for infrastructure providing physical separation from traffic, and lower comfort for cycling in mixed traffic (Aldred et al., 2017). These differences have been linked to women’s greater psychological aversion to risk, or their slower cycling speeds, but they also reflect women’s increased household roles and responsibilities for making serve-passenger trips, especially with children (Aldred et al., 2017; Emond et al., 2009; Garrard et al., 2012). Moreover, women’s cycling safety concerns reflect their different relationship to public space to men, which goes beyond fear of injury to include personal safety, verbal and physical harassment, or body-shaming (Graystone et al., 2022; Ravensbergen et al., 2020).
The effect of age on perceived cycling safety is less clear than that of gender (Aldred et al., 2017). Older cyclists generally have lower visual capacities, slower reflexes, and less muscular strength than younger cyclists (Van Cauwenberg, de Geus, et al., 2018). They also have less time constraints and tend to cycle for fitness or recreation rather than commuting (Zander et al., 2013). Older cyclists dislike high traffic volumes and speeds, and prefer physically separated infrastructure, but dislike sharing paths with other users because of their slower reflexes (Van Cauwenberg, Clarys, et al., 2018; Winters et al., 2015). They are more likely to cope with safety by avoiding cycling in traffic (Chataway et al., 2014). In addition to collisions, older cyclists are more fearful of single-vehicle crashes (falling off a bicycle) than younger cyclists due to their physical frailty (Schepers et al., 2020).
Cycling experience accumulated throughout life has been linked to higher perceived safety (Manton et al., 2016). It has two opposite effects. On one hand, it improves confidence in one’s abilities for cycling (Winters et al., 2015). On the other hand, over time, it increases exposure to crashes or near misses (Sanders, 2015). Thus, while inexperienced cyclists have a general fear of traffic, but tend to underestimate risks, experienced cyclists worry more about specific situations which they have experienced as dangerous (Sanders, 2015).
Frequency of cycling and perceived safety strongly influence each other and have a causal relationship. Individuals who are unafraid to cycle in traffic tend to cycle more often, while those fearful of cycling without cycle infrastructure tend to cycle less frequently (Chataway et al., 2014). Moreover, frequently cycling leads to accumulating experience and decreases the barrier effect of perceived safety on whether or not to cycle (Sanders, 2015).
3 Methods
3.1 Survey
To answer our research question, we use data taken from a survey of e-bike users conducted in the city of Lausanne, Switzerland. The survey was distributed to beneficiaries of a municipal subsidy for the purchase of an e-bike,7 as part of a long-standing subsidy programme.8 A database containing 3400 people who had received an e-bike subsidy was used to contacted respondents through a combined online and postal survey in June and July 2018. After excluding invalid addresses,9 1466 responses were obtained, a combined (postal and online) 45% response rate. The final sample for this study consisted of 1260 respondents.
The e-bike survey had a general goal of assessing e-bike users’ profiles and experiences. It contained three main parts: (1) mobility equipment including current e-bike (model, date of purchase, etc.) and motivations for purchase; (2) travel habits (trip motives, frequency, duration) and barriers to e-bike use; (3) experiences of e-bike use and comfort in different types of cycling infrastructure; (4) user profile and socio-demographic characteristics. For this paper, only relevant questions related to safety were selected on the basis of the theoretical framework.
3.2 Variables
To evaluate e-bikers’ perceived safety, 13 variables were selected in the survey. These variables consisted of statements which could be answered on a four-point Likert scale (strongly disagree, rather disagree, rather agree, strongly agree). A first set of variables corresponds to an individual’s cycling skills in different cycling infrastructures. Participants were asked to assess their level of comfort for cycling with an e-bike in situations with varying degrees of separation from traffic, namely (1) in mixed car traffic, (2) crossing an intersection or roundabout, (3) on a bus lane (allowing cyclists), (4) on a contraflow lane,10 (5) on a cycle lane or path with conventional cyclists,11 (6) on a sidewalk or pedestrian area with pedestrians.
A second set of variables corresponds to barriers, or how an individual appropriates the possibilities and conditions for cycling given by the territory to cycle or not. Participants were asked about the reasons preventing them from using their e-bike more, namely (1) having to use a road with strong traffic, (2) having to cycle at night, (3) a long or tiring trip, (4) unfavourable weather conditions. A third set of variables corresponds to perceived bikeability, or the spatial and social context of cycling. Participants were asked whether the following statements corresponded to their experience of using an e-bike: (1) “I feel safe in traffic”, (2) “There are enough cycle lanes and paths”, (3) “I feel respected by other road users”.
The following explanatory variables were included: socio-demographic information (age, gender, household type, employment status), mobility equipment (e-bike type, other vehicles and transport passes), purpose of e-bike use (utilitarian – work/study, shopping, going to leisure activities; recreational – sports or tours; mixed – both utilitarian and recreational), frequency of e-bike use (every day or almost; several times per week; a few times per month or less), winter e-bike use (“yes, like other seasons”; “yes, but less often”; “no”), conventional cycling experience12 (previously cycling for trips now made by e-bike; not previously cycling), and experience of e-bike use (purchase date under two years; over two years).
3.3 Context
Lausanne is the 4th largest city in Switzerland, with a population of 140,000 inhabitants in the municipality and 415,000 in the urban area (FSO, 2018), set on the shore of lake Geneva. The city offers an interesting setting for e-bikes as it is particularly hilly, with an elevation of over 500 metres from the lakeside (372 m) to the highest neighbourhoods (around 900 m). It is a low-cycling city with the fewest cycling trips among Swiss cities (1.6% compared to 7% nationally), the lowest rate of e-bike owning households (3.1% compared to 7% nationally) and bicycle-owning households (41.7% compared to 65% nationally) (FSO and FOSD, 2017).
Lausanne is not considered a cycle-friendly city and was ranked last in a national survey of commuter cyclists out of 24 cities, with 34% of respondents not feeling safe (compared to 14% nationally) and 55% not feeling respected by other road users (compared to 32% nationally) (Rérat, 2021a). The cycling infrastructure is recent, having grown from a length of 9.8 km in 2000 to 71.5 km in 2019 (Ville de Lausanne, 2020). It mostly consists of on-road cycle lanes, bus lanes, and some mixed-use paths and sidewalks shared with pedestrians, and a pedestrian zone where bicycles are tolerated.
3.4 Analysis
All analyses were conducted with SPSS version 26. In a first step, descriptive statistics were used to highlight significant differences between e-bike users, using Pearson’s Chi-square tests. In a second step, underlying factors were extracted from the 13 initial variables using principal component analysis (PCA) with orthogonal rotation (Varimax), retaining three components which had eigenvalues over 1 (Kaiser’s criterion) and explained in combination 54% of the variance. Sampling adequacy was verified with the Kaiser-Meyer-Olkin measure (KMO 0.814), with all items being greater than 0.697, above the accepted limit of 0.5 (Kaiser & Rice, 1974). In a third step, to create groups of e-bike users, we conducted a cluster analysis based on the three components. The optimal number of clusters was determined by running a hierarchical cluster analysis using Ward’s method. When analysing the dendrogram, two, three, and four cluster solutions were identified13. The latter was chosen as it offered the most explanatory potential for a typology. To create four groups of homogenous size, K-means clustering was used (Everitt et al., 2011). Lastly, we conducted four binary logistic regressions to identify the factors associated with being a member of each group of e-bike users.
The next section discusses our results. We start by presenting the profile of e-bike users in our sample (4.1) before describing their perceived safety (4.2). Later, we present our segmentation of four groups of e-bike users and identify the factors which differentiate them (4.3).
4 Results
4.1 Profile of e-bike users
Table 1 shows the characteristics of our sample of e-bike users. There are slightly more women (53%) than men. Most e-bike users are either middle-aged (40–59 years old) or younger than 40, whereas older adults (>60) are a minority. A higher share of women are under 40 years whereas more men are over 60 years. This reflects the increasing diffusion of e-bikes to women buyers over the years. Most e-bike users live in a household composed of couples with or without children. Half of all users are employed full-time, one in three part-time, while retirees, students and unemployed are a minority. This contrasts with existing studies where retired e-bike users were more common, especially in the Netherlands or Denmark (Haustein & Møller, 2016a; Kroesen, 2017) but also in Austria (Wolf & Seebauer, 2014).
Respondent characteristics.
| Variable name | Categories | Percentage |
|---|---|---|
| Gender | Female | 53% |
| Male | 47% | |
| Age | <40 years | 36% |
| 40–59 | 45% | |
| >60 years | 19% | |
| Household type | Alone | 18% |
| Alone with children | 6% | |
| Couple without children | 29% | |
| Couple with children | 43% | |
| Other | 4% | |
| Employment | Student | 3% |
| Part-time employed | 30% | |
| Full-time employed | 52% | |
| Retired | 11% | |
| Unemployed or other | 4% | |
| E-bike category | Pedelec (25 km/h) | 85% |
| S-Pedelec (45 km/h) | 16% | |
| Mobility tool ownership | Car ownership | 77% |
| Conventional bicycle ownership | 73% | |
| Motorcycle/scooter ownership | 24% | |
| Public transport pass ownership | 51% | |
| Frequency of e-bike use | Every day or almost | 42% |
| Several times per week | 36% | |
| A few times per month or less | 22% | |
| Weekly duration of e-bike use | Less than 1 hour | 31% |
| Between 1 and 4 hours | 56% | |
| More than 4 hours | 13% | |
| Winter use of e-bike | Yes, like other seasons | 25% |
| Yes, but less often | 48% | |
| No | 27% | |
| Type of e-bike use | Utility only | 32% |
| Mixed | 59% | |
| Recreational only | 9% | |
| Cycling experience | Previously cycled for trips by e-bike | 27% |
| E-bike experience | Purchase <2 years | 44% |
| Purchase >2 years | 56% | |
A majority of participants own a regular pedelec with an assistance until 25 km/h, while faster s-pedelecs reaching 45 km/h are mostly owned by men and middle-aged users. Three in four e-bike users own car and a conventional bicycle, and one in four own a motor two-wheeler, while only half have a public transport pass. Frequency of e-bike use is high, with four out of ten users cycling every day or almost, one in three cycling several times per week, and one in five less often. A higher share of women cycle daily compared to men, as well as half of all younger users under 40 compared to only one in four aged over 60. Three quarters of participants continue to use their e-bike in winter, even if less often than other seasons, whereas one in four stop cycling. Among older users, four out of ten stop cycling in winter. In terms of trip purposes, six out of ten users e-bike for a mix of both recreational (e.g. bicycle tours) and utilitarian activities (e.g. work trips, groceries), while utilitarian-only users account for a third, and strictly recreational users are a minority. Mixing utilitarian and recreational trips is more prevalent among women, whereas men tend to cycle more for either utilitarian or recreational trips.
Experience of conventional cycling is overall quite low, as only one user in four previously cycled for trips now done by e-bike, with men being more experienced than women. However, experience of e-bike use is higher, as more than half of all participants have owned their e-bike for more than two years, including two thirds of older adults.
4.2 E-bike users’ perceived safety
Perceived safety was measured using 13 variables (Figure 1). Overall, perceived safety appears to be low among e-bike users. Only one in six users agree that available infrastructure (cycle paths and lanes) is sufficient, and less than one in three feel safe in traffic or respected by other road users. Women and older users above 60 years are particularly critical when it comes to the supply of cycle lanes and paths and the feeling of safety in traffic.
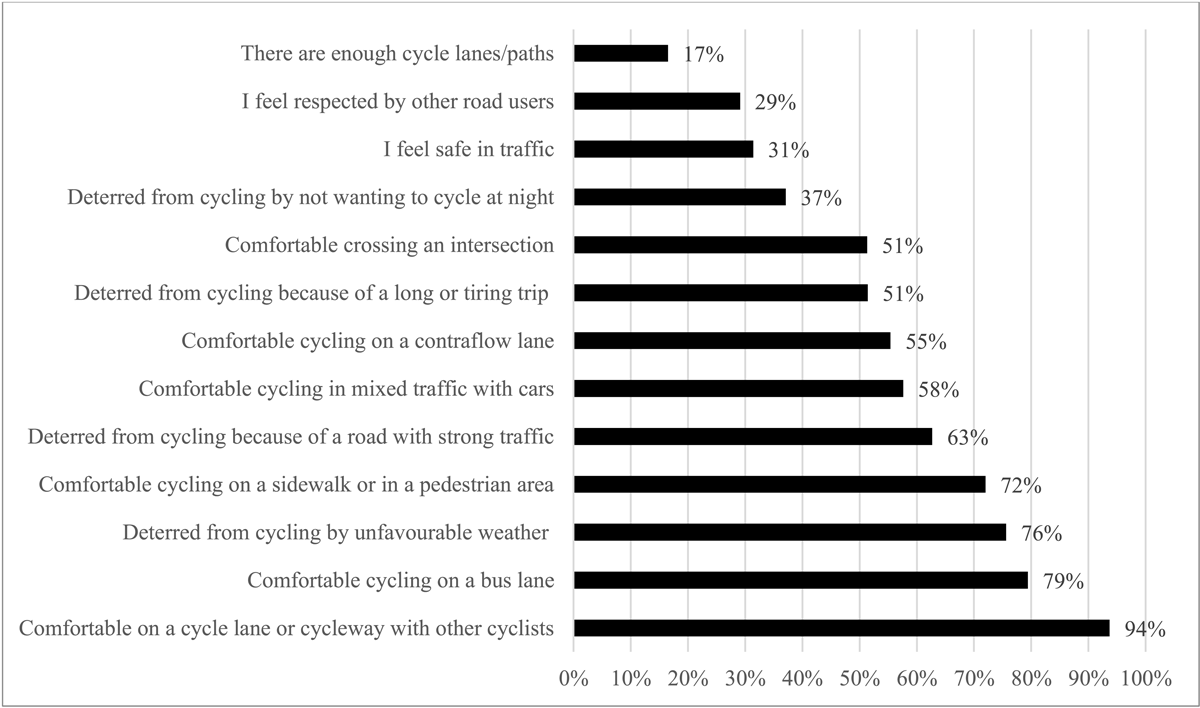
Measures of perceived e-bike safety. Only positive responses (agree or rather agree). N = 1260.
In terms of barriers, a majority of e-bike users agree to cycling less because of unfavourable weather conditions or having to use roads with a lot of traffic. About half of all users are deterred by a long or tiring trip, and a third by having to cycle at night. Older e-bike users and women are significantly more affected by barriers, especially cycling at night having to use roads with high traffic, a long or tiring trip, and unfavourable weather.
E-bike users’ comfort varies strongly when cycling in different types of infrastructure, depending on the level of separation offered from motor traffic. Only slightly more than half are comfortable using their e-bike where there is no separation, such as in mixed car traffic, crossing an intersection or roundabout, or cycling on contraflow lanes in the opposite direction to traffic. Gender differences for cycling in non-separated conditions are significant; fewer women are comfortable in mixed car traffic, at intersections or on contraflow lane, while older users are also significantly less comfortable than those younger than 40 when crossing an intersection or cycling in mixed car traffic.
E-bikers’ comfort increases noticeably when sharing infrastructure with slower users like sidewalks and pedestrian areas, or bus lanes which offer some separation from cars, with 3 in 4 users being comfortable in these two situations. However, older users and women remain less comfortable, suggesting a fear of buses remains. As expected, almost all e-bike users feel rather or very comfortable using cycle lanes or dedicated paths separated from the road, the only infrastructure shared with other cyclists. As expected, we see no difference in comfort between men or women, and only small differences between age groups.
4.3 Components of perceived safety
To categorize e-bike users into groups, a principal component analysis is used to extract three components of safety from the 13 variables (Table 2). The first component, “comfort”, loads onto items representing the comfort for cycling in different situations. The second component, “satisfaction” includes assessment of bikeability in terms of overall safety (“I feel safe in traffic”), relations with other road users (“I feel respected by other road users”), and satisfaction with the cycling network (“There are enough cycle lanes/paths”). Two items, “comfortable cycling in mixed traffic” and “comfortable crossing an intersection”, load onto both the components of “satisfaction” as well as “comfort”, suggesting that being comfortable in traffic is related with how cycling conditions are perceived. The third and last component, “barriers”, represents both practical barriers (weather, night-time or tiredness) but also safety-related barriers such as roads with a lot of traffic, an item which also loads onto the component “satisfaction”.
Components of perceived e-bike safety. N = 1260.
| Items | Component loadings (values over 0.4 in bold) |
||
|---|---|---|---|
| Comfort | Satisfaction | Barriers | |
| Comfortable cycling on a bus lane | 0.76 | 0.12 | –0.09 |
| Comfortable cycling on a sidewalk or in a pedestrian area | 0.73 | –0.06 | 0.09 |
| Comfortable cycling on a cycle lane or path with other cyclists | 0.67 | 0.06 | –0.01 |
| At ease cycling on a contraflow lane | 0.65 | 0.15 | –0.12 |
| I feel safe in traffic | 0.22 | 0.78 | –0.13 |
| There are enough cycle lanes/paths | –0.09 | 0.75 | 0.14 |
| I feel respected by other road users | 0.07 | 0.70 | 0.14 |
| Comfortable cycling in mixed traffic | 0.49 | 0.52 | –0.33 |
| Comfortable crossing an intersection | 0.47 | 0.49 | –0.26 |
| Deterred from cycling by not wanting to cycle at night | –0.17 | –0.05 | 0.73 |
| Deterred from cycling by unfavourable weather | 0.00 | 0.04 | 0.72 |
| Deterred from cycling by a long or tiring trip | 0.03 | 0.17 | 0.66 |
| Deterred from cycling by having to use a road with high traffic | –0.10 | –0.42 | 0.56 |
| Cronbach’s Alpha | 0.77 | 0.75 | 0.63 |
4.4 Groups of e-bike users
After performing a cluster analysis, we identify four groups of e-bike users. Figure 2 represents each group’s average factor score for the three components (comfort, satisfaction, and barriers). To further describe these groups, four logistic regressions are used to identify the variables associated with being a member of each group (Table 3).
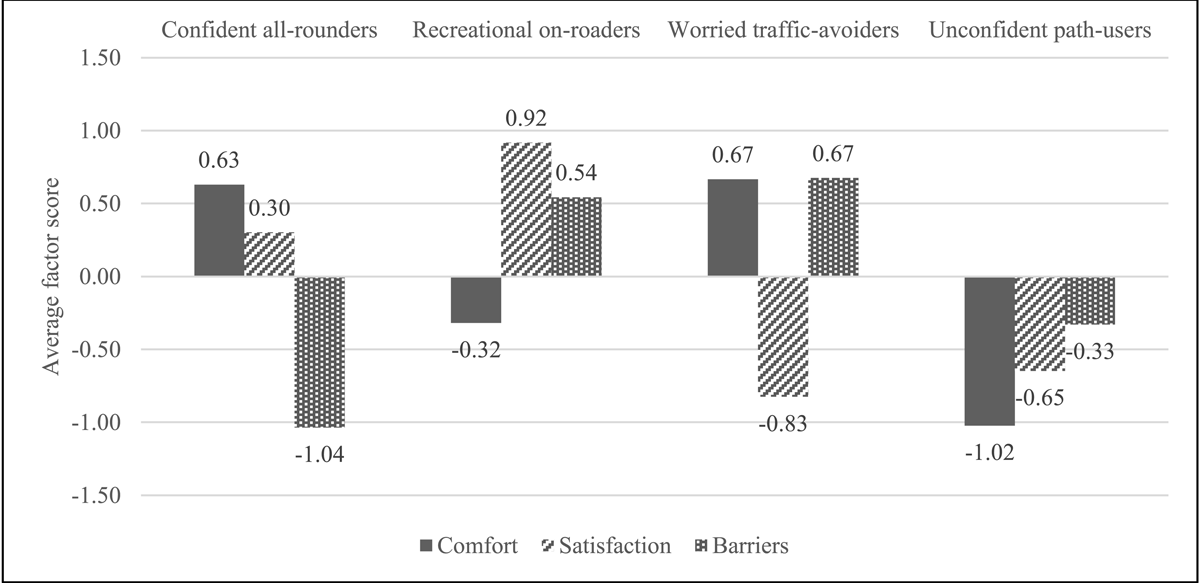
E-bike user groups and average factor scores for comfort, satisfaction, and barriers. N = 1260.
Comparison of 4 logistic regression models. N = 1260.
| Dependent variable | Confident all-rounders | Recreational on-roaders | Worried traffic-avoiders | Unconfident path-users | ||||
|---|---|---|---|---|---|---|---|---|
| Independent variables | Sig. | Exp(B) | Sig. | Exp(B) | Sig. | Exp(B) | Sig. | Exp(B) |
| Male | 0*** | 2.274 | 0.781 | 0.962 | 0.009** | 0.671 | 0.016* | 0.684 |
| Age: 40–59 (REF) | 0.036* | 0.332 | 0.012* | 0.663 | ||||
| Age: under 40 | 0.131 | 1.277 | 0.138 | 1.251 | 0.005** | 0.633 | 0.828 | 0.964 |
| Age: 60+ | 0.101 | 0.628 | 0.674 | 1.093 | 0.77 | 1.065 | 0.436 | 1.196 |
| Frequency: every day or almost (REF) | 0.009** | 0.013* | 0.887 | 0.917 | ||||
| Frequency: a few times per week | 0.002** | 0.565 | 0.003** | 1.628 | 0.765 | 1.054 | 0.68 | 0.926 |
| Frequency: a few times per month or less | 0.327 | 0.768 | 0.098 | 1.447 | 0.834 | 0.951 | 0.893 | 0.967 |
| Winter use: yes, same as other seasons (REF) | 0*** | 0.002** | 0.002** | 0.167 | ||||
| Winter use: Yes, but less often | 0*** | 0.338 | 0.001** | 1.842 | 0.001** | 1.922 | 0.248 | 1.267 |
| Winter use: No | 0*** | 0.128 | 0.001** | 2.104 | 0.001** | 2.238 | 0.059 | 1.602 |
| Mix of utilitarian and recreational trips (REF) | 0.252 | 0.074 | 0.152 | 0.802 | ||||
| Utilitarian trips only | 0.529 | 1.108 | 0.175 | 1.232 | 0.123 | 0.773 | 0.617 | 0.917 |
| Recreational trips only | 0.149 | 0.535 | 0.039* | 1.714 | 0.16 | 0.654 | 0.733 | 1.107 |
| Previously cycling for trips | 0.486 | 1.125 | 0.875 | 0.975 | 0.802 | 1.044 | 0.35 | 0.844 |
| E-bike purchase >2 years | 0.313 | 1.172 | 0.057 | 0.764 | 0.947 | 1.01 | 0.202 | 1.223 |
| Constant | 0.015* | 0.594 | 0*** | 0.186 | 0*** | 0.275 | 0*** | 0.233 |
-
Significance level: * p < 0.05; ** p < 0.01; *** p < 0.001.
The first group, confident all-rounders (N = 307, 24.4%) are comfortable cycling in any kind of infrastructure without separation from traffic, including crossing an intersection (mean score: 3.12 out of 4) or cycling in mixed car traffic (3.25). However, they have average values for the component “satisfaction”, because although they feel quite safe in traffic (2.54), they are unsatisfied with available cycling infrastructure (1.72) and do not feel respected by other road users (2.13). A low score for “barriers” suggests they are not bothered by external conditions such as unfavourable weather (2.35), a long or tiring trip (1.99), roads with strong traffic (1.88) or cycling at night (1.3). The regression model shows that being a confident all-rounder is positively associated with being male and cycling every day or almost, and negatively associated with interrupting e-bike use in winter. This suggests that members of this group are regular cyclists with a low sensibility to weather and traffic conditions.
The second group, recreational on-roaders (N = 370, 29.4%) show the highest score for satisfaction with cycling conditions, including cycle lanes/paths available (2.41), feeling respected by other road users (2.55), and feeling safe in traffic (2.52). Their level of comfort is average but does not differ whether cycling without separation – in mixed traffic (2.73) or an intersection (2.63) – and when using separated infrastructure such as sidewalks (2.76), bus lanes (2.95) or contraflow lanes (2.44), though they still prefer cycle lanes (3.29). They are quite sensitive to practical barriers to cycling such as bad weather (3.45), long and tiring trips (3.01), or cycling at night (2.61). Being a recreational on-roader is positively associated with e-biking a few times per week rather than daily, reduced winter e-bike use, and e-biking strictly for recreational trips (e.g. bicycle tours). This recreational focus suggests that e-biking is not their main mode of transport, which might explain their lower expectations for cycling safety than other groups.
The third group, utilitarian traffic-avoiders (N = 308, 24.4%) are very comfortable when using infrastructure separated from traffic such as cycle lanes (3.64), sidewalks (3.42), bus lanes (3.42), but feel uneasy when mixing with cars in traffic (2.33) or crossing an intersection (2.25). They are the most unsatisfied with cycling conditions, in terms of feeling safe in traffic (1.64), cycle lane/path availability (1.31), and feeling respected by other road users (1.77). They are also very sensitive to safety-related barriers such as having to cycle in strong traffic (3.47) or unfavourable weather (3.49). Being a utilitarian traffic-avoider is associated with being older than 40 years, and being a woman, two characteristics which may explain their aversion to traffic. It is also associated with reduced e-bike use in winter, indicating a sensibility to external conditions.
The fourth and last group, unconfident path-users (N = 275, 21.8%) score negatively on all three components of safety. They have the lowest comfort for cycling in mixed traffic (1.99), intersections (1.92), contraflow lanes (1.96) as well as in separated infrastructure like sidewalks shared with pedestrians (2.35) or bus lanes (2.39) and are only at ease on dedicated cycle lanes or paths (2.89). They are also dissatisfied with cycling conditions, available cycle lanes/paths (1.39), safety in traffic (1.62) and feeling respected by other road users (1.62). Surprisingly, they are not sensitive to barriers of weather (2.81), tiredness (2.2) or night-time (2.09), though they still avoid cycling on roads with strong traffic (3.02). Being an unconfident path-user is only statistically associated with one factor: being a woman (near-significant: interrupting cycling in winter). This suggests that gender represents the main factor for their low safety.
5 Discussion
This section compares our results within existing literature and offers some conclusions for policy and future research. This paper had two objectives: (1) to understand how e-bike users perceive safety and (2) to offer a segmentation based on their level of perceived safety. We used 13 items to measure perceived safety, which we reduced to three components: comfort for cycling in different situations, satisfaction with cycling conditions, and barriers to cycling.
Overall, we found levels of perceived safety to be low among e-bike users in Lausanne. Notably, fewer than 2 in 10 users were satisfied with cycle infrastructure and only 3 in 10 felt respected by other road users or safe cycling in traffic with motor vehicles. Consistent with existing literature on conventional cyclists’ preferences (Aldred et al., 2017), we found e-bikers’ comfort for cycling varied strongly depending on the level of infrastructural separation offered; while almost all e-bike users felt at ease on a cycle lane, and a majority on a sidewalk or bus lane, only half were comfortable in mixed traffic among cars, intersections, or contraflow lanes. Despite e-bikes’ technical advantages (ease of maintaining a higher speed, stronger acceleration), their users still seem to have a strong preference for separated infrastructure. Moreover, roads with strong traffic were (after unfavourable weather) the most common barriers to e-bike use for two thirds of e-bike users.
Based on their perceived safety, we identified four groups of e-bike users. Confident all-rounders are comfortable cycling in any road conditions, unaffected by barriers but wary of cycling conditions, and likely to be male and to cycle every day. Recreational on-roaders are very satisfied with cycling conditions and relatively comfortable in traffic, but more likely to use their e-bike for infrequent recreational trips; Worried traffic-avoiders are uncomfortable cycling without separation from traffic, very critical of cycling conditions, and likely to be older than 60 years and to be women; Unconfident path-users are uncomfortable in most situations except cycle paths, unsatisfied with cycling conditions, and also likely to be women. These four groups are similar to segmentations of conventional cyclists based on infrastructure preferences (Dill & McNeil, 2013). The first two groups represent the most confident users. Confident all-rounders would cycle regardless of the absence of infrastructure, while recreational on-roaders prefer using the road rather than sharing space with pedestrians or buses. Meanwhile, the other two groups are safety conscious. Worried traffic avoiders feel uncomfortable without separation from traffic and unconfident path-users would avoid anything less than a dedicated cycle lane or path. This suggests that despite electrical assistance, which may reduce barriers linked to physical capabilities and “equalize” between different users, important differences in e-bike users’ perceived safety remain.
Gender proved to be a significant factor for e-bike users’ perceived safety, as has been found among conventional cyclists (Aldred et al., 2017; Garrard et al., 2008). Women were generally less satisfied with cycling conditions, felt less safe in traffic, preferred separated infrastructure (e.g. sidewalks and cycle lanes) and were more affected by barriers to e-bike use. The importance of gender confirms findings by Haustein & Møller (2016) that being a woman and older than 60 were associated with lower perceived safety when e-biking. Women’s greater emphasis on safety can be explained in several ways, including differences in familial roles (e.g. more serve trips, parental duties) and shorter, more frequent cycle trips (Garrard et al., 2012). Indeed, a higher share of women in our sample used their e-bike daily compared to men (46% vs. 37%). Others have explained gender differences for safety by women’s lower cycling experience since childhood (Emond et al., 2009). In our sample, we found fewer women previously used a conventional bicycle, and had owned an e-bike for more than two years, though this may also reflect differences in age between male and female e-bike users. A final reason for gender differences may simply be due to men’s higher confidence and propensity to minimize fears when answering survey questions (Garrard et al., 2012).
Age differences were also significant for e-bikers’ safety. Older adults (<60) felt less safe overall in traffic, but also on bus lanes and cycle paths shared with other cyclists. They were also much more sensible to barriers than younger users, including cycling at night, traffic, or long or tiring trips. This confirms studies which found older adults are more sensitive to traffic and cycling at night because of lower eyesight and reaction time, as well as greater vulnerability in case of a crash (Van Cauwenberg, Clarys, et al., 2018). Our results also confirm that older e-bike users, like cyclists, may have difficulties cohabiting on shared surfaces with other cyclists and pedestrians (Winters et al., 2015)
Frequent (daily) e-bike use, as well as continuing to cycle in winter, were found to be significantly related to e-bike safety, specifically to being a “confident all-rounder”. Of course, causality could be reversed, with users who feel the safest being the ones that cycle most often, and those that continue to cycle in winter. This seems to confirm that cycling frequency reduces sensitivity to barriers (Sanders, 2015). A slightly different result was reported by Haustein & Møller (2016a) who found the length of daily kilometres cycled by e-bike to be associated with lower perceived safety. Unfortunately, we lack data on distance travelled to verify this result.
Experience of e-biking (years since e-bike purchase) was not found to have any significant effect on perceived safety, in contrast to Haustein and Møller (2016b) who reported that greater e-bike experience improved perceived safety. This may be due to the specific characteristics of our sample, which included many younger, but less experienced users. Similarly, we found no effect for previously using a conventional bicycle for trips now made by e-bike. This confirms Haustein and Møller (2016), who also found no such effect, but contradicts Edge et al., (2018) who found e-bike users switching from conventional cycling to the e-bike were more comfortable in traffic than those returning to cycling. An explanation for this result may be that the variable used to assess cycling experience only included previously cycling for trips which are now made by e-bike, excluding other kinds of trips (e.g. sports cycling) which could constitute a form of cycling experience.
Future research should aim to further understand how e-bikers’ experiences may influence their perceived cycling safety. For instance, negative experiences such as crashes and near misses have been shown to reduce perceived safety (Lee et al., 2015; Sanders, 2015). Biographical or longitudinal designs could help to understand how a person’s perception of cycling safety varies throughout the life course.
6 Conclusion
Considering our results through the lens of a system of vélomobility, we now offer a few practical recommendations to inform planning policies. Improving perceived safety among e-bike users requires addressing the gap in the relationship between individuals with different cycling potentials, and a territory’s bikeability. Although individualized policies such as cycle training can be effective in increasing skills or confidence, there will always be safety-conscious users. Therefore, improving the territorial hosting potential should be a priority.
At the territorial level, cycling infrastructure is required to cater to different segments of e-bike users. Building cycle paths or protected lanes which separate e-bikers from motor traffic and redesigning intersections would improve comfort for the most safety-conscious users, while also improving satisfaction among more confident users. Meanwhile, shared infrastructure such as sidewalks, bus lanes, or contraflow lanes, should be avoided as it does not appeal to the whole spectrum of e-bike users (the least and most confident). Given the increasing volumes and types of cyclists travelling at different speeds (including cargo bikes), such infrastructure should provide ample width to allow overtaking safely.
Barriers to e-bike use linked to external conditions (night-time, weather) could also be reduced through improved street lighting and year-round maintenance of cycle infrastructure, increasing the overall frequency of e-bike use and avoiding seasonal winter interruptions. Lastly, improving the social context of cycling in Lausanne could be done through awareness campaigns which promote a positive, normal image of e-biking, for example by focusing on its advantages for health, efficiency, and enjoyment, rather than on road safety. This would help to deconstruct the image of e-cycling as a dangerous practice.
The results of this study may not be generalizable to all contexts, as they represent e-bike users’ perceptions of safety in a specific, low-cycling context and hilly topographical setting (Aldred & Jungnickel, 2014). Nonetheless, they should provide a useful comparison point for other low-cycling cities where cycling infrastructure was developed recently and where e-bikes have enabled many people to consider getting into cycling. This rapid development of e-bikes has opened new challenges by highlighting inadequate cycling conditions. While e-bikes have succeeded in attracting a variety of cyclists with different profiles and levels of experience, improving perceived safety will be necessary in order to keep them in the future.
Notes
- We refer strictly to pedal-assisted bicycles. Other types of e-bikes can be ridden without pedaling but are rare in European contexts. ⮭
- There are two main categories of e-bikes in Switzerland. Regular e-bikes (pedelecs) with an assistance until 25 km/h account for 85% of sales, while faster e-bikes with an assistance until 45 km/h (speed-pedelecs) represent 15% of sales. ⮭
- The British medical journal has banned use of the word “accident”, as it suggests that such an event occurred by chance, which is often not the case (Davis & Pless, 2001). ⮭
- One of the reasons for under-reporting of cycling crashes is a lack of vehicle insurance. ⮭
- The evidence is mixed. Although some studies do find a higher risk of falls (single-vehicle crashes), it may be due to higher rates of accident reporting, and higher age. Moreover, exposure data on e-bike trips is very unreliable. ⮭
- The “strong and fearless”, “enthused and confident”, “interested but concerned”, and “no way no how”. ⮭
- At the time of the study, this subsidy amounted to 15% of the price of an e-bike, with a maximum of 500 Swiss Francs, with another smaller subsidy for the purchase of an e-bike battery. ⮭
- Since 2000, but half of all subsidies were distributed in the four years before the study. ⮭
- Residential relocations or expired e-mail addresses. ⮭
- A painted cycle lane in a one-way street where cyclists ride in the opposite direction of traffic. ⮭
- Although the distinction between on-road cycle lanes and separated paths is important, there are almost no cycle paths in Lausanne, and it was estimated that many users would confuse the two terms. ⮭
- Participants were asked which mode of transport was previously used for trips now taken by e-bike and this was recoded into a binary variable for previous cycling. ⮭
- A two or three-group typology would lead to “high-safety”, “medium” or “low-safety” groups. ⮭
Appendix
Measures of perceived safety by age and gender.
| Variables | Under 40 years | 40–59 years | Over 60 years | Statistical test (chi-square) | Women | Men | Statistical test (chi-square) |
|---|---|---|---|---|---|---|---|
| Comfortable on a cycle lane or cycleway with other cyclists | 95% | 94% | 90% | p < 0.05 | 94% | 93% | n.s. |
| Comfortable cycling on a bus lane | 84% | 80% | 67% | p < 0.001 | 76% | 81% | p < 0.05 |
| Deterred from cycling by unfavourable weather | 74% | 76% | 83% | p < 0.05 | 79% | 74% | p < 0.05 |
| Comfortable cycling on a sidewalk or in a pedestrian area | 69% | 74% | 71% | n.s. | 72% | 71% | n.s. |
| Deterred from cycling by having to use a road with high traffic | 58% | 63% | 79% | p < 0.001 | 67% | 60% | p < 0.01 |
| Comfortable cycling in mixed traffic with cars | 61% | 59% | 42% | p < 0.001 | 48% | 67% | p < 0.001 |
| Comfortable cycling on a contraflow lane | 56% | 57% | 50% | n.s. | 50% | 61% | p < 0.001 |
| Deterred from cycling by a long or tiring trip | 50% | 49% | 64% | p < 0.001 | 57% | 48% | p < 0.01 |
| Comfortable crossing an intersection | 61% | 50% | 35% | p < 0.001 | 46% | 58% | p < 0.001 |
| Deterred from cycling by not wanting to cycle at night | 27% | 38% | 64% | p < 0.001 | 42% | 34% | p < 0.01 |
| I feel safe in traffic | 35% | 31% | 24% | p < 0.01 | 28% | 34% | p < 0.05 |
| I feel respected by other road users | 30% | 28% | 30% | n.s. | 28% | 30% | n.s. |
| There are enough cycle lanes/paths | 21% | 14% | 13% | p < 0.01 | 13% | 20% | p < 0.001 |
Average responses by e-bike user group (1 = disagree, 2 = rather disagree, 3 = rather agree, 4 = agree).
| Cluster group | Confident all-rounders (N = 307) | Recreational on-roaders (N = 370) | Worried traffic-avoiders (N = 308) | Unconfident path-users (N = 275) | Total (N = 1260) | |||||
|---|---|---|---|---|---|---|---|---|---|---|
| Variables | Mean | SD | Mean | SD | Mean | SD | Mean | SD | Mean | SD |
| Comfortable crossing an intersection | 3.12 | 0.7 | 2.63 | 0.7 | 2.25 | 0.8 | 1.92 | 0.7 | 2.5 | 0.8 |
| Comfortable cycling on a contraflow lane | 3.08 | 0.8 | 2.44 | 0.8 | 2.81 | 0.9 | 1.96 | 0.8 | 2.58 | 0.9 |
| Comfortable cycling in mixed traffic with cars | 3.25 | 0.6 | 2.73 | 0.7 | 2.33 | 0.8 | 1.99 | 0.7 | 2.6 | 0.8 |
| Comfortable cycling on a sidewalk or in a pedestrian area | 3.24 | 0.8 | 2.76 | 0.8 | 3.42 | 0.7 | 2.35 | 0.8 | 2.95 | 0.8 |
| Comfortable cycling on a bus lane | 3.56 | 0.6 | 2.95 | 0.7 | 3.42 | 0.6 | 2.39 | 0.8 | 3.09 | 0.8 |
| Comfortable on a cycle lane or cycleway with other cyclists | 3.7 | 0.5 | 3.29 | 0.6 | 3.64 | 0.5 | 2.89 | 0.7 | 3.39 | 0.6 |
| There are enough cycle lanes/paths | 1.72 | 0.7 | 2.41 | 0.6 | 1.31 | 0.5 | 1.39 | 0.6 | 1.75 | 0.8 |
| I feel respected by other road users | 2.13 | 0.7 | 2.55 | 0.6 | 1.77 | 0.7 | 1.62 | 0.6 | 2.05 | 0.8 |
| I feel safe in traffic | 2.54 | 0.7 | 2.52 | 0.6 | 1.64 | 0.6 | 1.62 | 0.6 | 2.12 | 0.8 |
| Deterred from cycling by unfavourable weather | 2.35 | 1.0 | 3.45 | 0.6 | 3.49 | 0.7 | 2.81 | 0.9 | 3.05 | 0.9 |
| Deterred from cycling by having to use a road with high traffic | 1.88 | 0.9 | 2.68 | 0.9 | 3.47 | 0.8 | 3.02 | 1.0 | 2.75 | 1.1 |
| Deterred from cycling by a long or tiring trip | 1.99 | 0.9 | 3.01 | 0.8 | 2.8 | 0.9 | 2.2 | 0.9 | 2.53 | 1.0 |
| Deterred cycling by not wanting to cycle at night | 1.3 | 0.5 | 2.61 | 1.0 | 2.62 | 1.0 | 2.09 | 1.0 | 2.18 | 1.0 |
Acknowledgements
The author would like to thank the Industrial Services of the City of Lausanne (SiL) for supporting this research and allowing access to their database.
Competing Interests
The author has no competing interests to declare.
References
1 Aldred, R. (2016). Cycling near misses: their frequency, impact, and prevention. Transportation Research Part A: Policy and Practice, 90, 69–83. DOI: http://doi.org/10.1016/j.tra.2016.04.016
2 Aldred, R., Elliott, B., Woodcock, J., & Goodman, A. (2017). Cycling provision separated from motor traffic: a systematic review exploring whether stated preferences vary by gender and age. Transport reviews, 37(1), 29–55. DOI: http://doi.org/10.1080/01441647.2016.1200156
3 Aldred, R., & Jungnickel, K. (2014). Why culture matters for transport policy: the case of cycling in the UK. Journal of Transport Geography, 34, 78–87. DOI: http://doi.org/10.1016/j.jtrangeo.2013.11.004
4 Behrendt, F. (2018). Why cycling matters for electric mobility: towards diverse, active and sustainable e-mobilities. Mobilities, 13(1), 64–80. DOI: http://doi.org/10.1080/17450101.2017.1335463
5 Chataway, E. S., Kaplan, S., Nielsen, T. A. S., & Prato, C. G. (2014). Safety perceptions and reported behavior related to cycling in mixed traffic: a comparison between Brisbane and Copenhagen. Transportation Research Part F: Traffic Psychology and Behaviour, 23, 32–43. DOI: http://doi.org/10.1016/j.trf.2013.12.021
6 Chaurand, N., & Delhomme, P. (2013). Cyclists and drivers in road interactions: a comparison of perceived crash risk. Accident Analysis & Prevention, 50, 1176–1184. DOI: http://doi.org/10.1016/j.aap.2012.09.005
7 Cox, P. (2019). Cycling: a sociology of vélomobility. Routledge. DOI: http://doi.org/10.4324/9781315533698
8 Cresswell, T. (2010). Towards a politics of mobility. Environment and Planning D: Society and Space, 28(1), 17–31. DOI: http://doi.org/10.1068/d11407
9 Daley, M., & Rissel, C. (2011). Perspectives and images of cycling as a barrier or facilitator of cycling. Transport Policy, 18(1): 211–216. DOI: http://doi.org/10.1016/j.tranpol.2010.08.004
10 Damant-Sirois, G., Grimsrud, M., & El-Geneidy, A. M. (2014). What’s your type: a multidimensional cyclist typology. Transportation, 41(6), 1153–1169. DOI: http://doi.org/10.1007/s11116-014-9523-8
11 Davis, R. M., & Pless, B. (2001). BMJ bans “accidents”. BMJ : British Medical Journal, 322(7298), 1320–1321. DOI: http://doi.org/10.1136/bmj.322.7298.1320
12 Dill, J., & McNeil, N. (2013). Four types of cyclists? Examination of typology for better understanding of bicycling behavior and potential. Transportation Research Record, 2387(1), 129–138. DOI: http://doi.org/10.3141/2387-15
13 Dill, J., & McNeil, N. (2016). Revisiting the four types of cyclists: findings from a national survey. Transportation Research Record, 2587(1), 90–99. DOI: http://doi.org/10.3141/2587-11
14 Edge, S., Dean, J., Cuomo, M., & Keshav, S. (2018). Exploring e-bikes as a mode of sustainable transport: a temporal qualitative study of the perspectives of a sample of novice riders in a Canadian city. The Canadian Geographer/Le Géographe Canadien, 62(3), 384–397. DOI: http://doi.org/10.1111/cag.12456
15 Emond, C., Tang, W., & Handy, S. (2009). Explaining gender difference in bicycling behavior. Transportation Research Record, 2125(1), 16–25. DOI: http://doi.org/10.3141/2125-03
16 Everitt, B. S., Landau, S., Leese, M., & Stahl, D. (2011). Cluster analysis 5th ed. John Wiley. DOI: http://doi.org/10.1002/9780470977811
17 Félix, R., Moura, F., & Clifton, K. J. (2017). Typologies of Urban Cyclists: Review of Market Segmentation Methods for Planning Practice. Transportation Research Record, 2662(1), 125–133. DOI: http://doi.org/10.3141/2662-14
18 Fishman, E., & Cherry, C. (2016). E-bikes in the mainstream: reviewing a decade of research. Transport Reviews, 36(1), 72–91. DOI: http://doi.org/10.1080/01441647.2015.1069907
19 FSO. (2018). Portraits City Statistics 2018: Agglomerations. https://www.bfs.admin.ch/bfs/fr/home/statistiken/querschnittsthemen/city-statistics/agglomerationsportraets/lausanne.html
20 FSO, & FOSD. (2017). Comportement de la population en matière de transports—Résultats du microrecensement mobilité et transports 2015 [Swiss micro-census on mobility and transport 2015].
21 Garrard, J., Handy, S., & Dill, J. (2012). Women and cycling. In City Cycling, (pp. 211–234). MIT Press.
22 Garrard, J., Rose, G., & Lo, S. K. (2008). Promoting transportation cycling for women: the role of bicycle infrastructure. Preventive Medicine, 46(1), 55–59. DOI: http://doi.org/10.1016/j.ypmed.2007.07.010
23 Gatersleben, B., & Haddad, H. (2010). Who is the typical bicyclist? Transportation Research Part F: Traffic Psychology and Behaviour, 13(1), 41–48. DOI: http://doi.org/10.1016/j.trf.2009.10.003
24 Geller, R. (2006). Four Types of Cyclists. Portland Office of Transportation. https://www.portlandoregon.gov/transportation/article/264746
25 Graystone, M., Mitra, R., & Hess, P. M. (2022). Gendered perceptions of cycling safety and on-street bicycle infrastructure: bridging the gap. Transportation Research Part D: Transport and Environment, 105, 103237. DOI: http://doi.org/10.1016/j.trd.2022.103237
26 Haustein, S., Koglin, T., Nielsen, T. A. S., & Svensson, Å. (2020). A comparison of cycling cultures in Stockholm and Copenhagen. International Journal of Sustainable Transportation, 14(4), 280–293. DOI: http://doi.org/10.1080/15568318.2018.1547463
27 Haustein, S., & Møller, M. (2016a). Age and attitude: changes in cycling patterns of different e-bike user segments. International journal of Sustainable Transportation, 10(9), 836–846. DOI: http://doi.org/10.1080/15568318.2016.1162881
28 Haustein, S., & Møller, M. (2016b). E-bike safety: individual-level factors and incident characteristics. Journal of Transport & Health, 3(3), 386–394. DOI: http://doi.org/10.1016/j.jth.2016.07.001
29 Heinen, E., Maat, K., & Van Wee, B. (2011). The role of attitudes toward characteristics of bicycle commuting on the choice to cycle to work over various distances. Transportation Research Part D: Transport and Environment, 16(2), 102–109. DOI: http://doi.org/10.1016/j.trd.2010.08.010
30 Hiselius, L. W., & Svensson, Å. (2017). E-bike use in Sweden–CO2 effects due to modal change and municipal promotion strategies. Journal of Cleaner Production, 141, 818–824. DOI: http://doi.org/10.1016/j.jclepro.2016.09.141
31 Horton, D. (2007). Fear of cycling. In Cycling and Society, (pp. 133–152). Routledge.
32 Jacobsen, P. L., Racioppi, F., & Rutter, H. (2009). Who owns the roads? How motorised traffic discourages walking and bicycling. Injury Prevention, 15(6), 369–373. DOI: http://doi.org/10.1136/ip.2009.022566
33 Jones, T., Harms, L., & Heinen, E. (2016). Motives, perceptions and experiences of electric bicycle owners and implications for health, wellbeing and mobility. Journal of Transport Geography, 53, 41–49. DOI: http://doi.org/10.1016/j.jtrangeo.2016.04.006
34 Juhra, C., Wieskoetter, B., Chu, K., Trost, L., Weiss, U., Messerschmidt, M., Malczyk, A., Heckwolf, M., & Raschke, M. (2012). Bicycle accidents–Do we only see the tip of the iceberg? A prospective multi-centre study in a large German city combining medical and police data. Injury, 43(12), 2026–2034. DOI: http://doi.org/10.1016/j.injury.2011.10.016
35 Kaiser, H. F., & Rice, J. (1974). Little jiffy, mark IV. Educational and Psychological Measurement, 34(1), 111–117. DOI: http://doi.org/10.1177/001316447403400115
36 Kaufmann, V. (2011). Re-thinking the city: urban dynamics and motility. EPFL Press.
37 Koglin, T., & Rye, T. (2014). The marginalisation of bicycling in Modernist urban transport planning. Journal of Transport & Health, 1(4), 214–222. DOI: http://doi.org/10.1016/j.jth.2014.09.006
38 Kroesen, M. (2017). To what extent do e-bikes substitute trave l by other modes? Evidence from the Netherlands. Transportation Research Part D: Transport and Environment, 53, 377–387. DOI: http://doi.org/10.1016/j.trd.2017.04.036
39 Kummeneje, A.-M., Ryeng, E. O., & Rundmo, T. (2019). Seasonal variation in risk perception and travel behaviour among cyclists in a Norwegian urban area. Accident Analysis & Prevention, 124, 40–49. DOI: http://doi.org/10.1016/j.aap.2018.12.021
40 Lee, A., Underwood, S., & Handy, S. (2015). Crashes and other safety-related incidents in the formation of attitudes toward bicycling. Transportation Research Part F: Traffic Psychology and Behaviour, 28, 14–24. DOI: http://doi.org/10.1016/j.trf.2014.11.001
41 Lowry, M., Callister, D., Gresham, M., & Moore, B. (2012). Assessment of Communitywide Bikeability with Bicycle Level of Service. Transportation Research Record, 2314(1), 41–48. DOI: http://doi.org/10.3141/2314-06
42 Manton, R., Rau, H., Fahy, F., Sheahan, J., & Clifford, E. (2016). Using mental mapping to unpack perceived cycling risk. Accident Analysis & Prevention, 88, 138–149. DOI: http://doi.org/10.1016/j.aap.2015.12.017
43 Marincek, D., & Rérat, P. (2021). From conventional to electrically-assisted cycling: a biographical approach to the adoption of the e-bike. International Journal of Sustainable Transportation. 15(10), 768–777. DOI: http://doi.org/10.1080/15568318.2020.1799119
44 Møller, M., & Hels, T. (2008). Cyclists’ perception of risk in roundabouts. Accident Analysis & Prevention, 40(3), 1055–1062. DOI: http://doi.org/10.1016/j.aap.2007.10.013
45 Parkin, J., Wardman, M., & Page, M. (2007). Models of perceived cycling risk and route acceptability. Accident Analysis & Prevention, 39(2), 364–371. DOI: http://doi.org/10.1016/j.aap.2006.08.007
46 Petzoldt, T., Schleinitz, K., Heilmann, S., & Gehlert, T. (2017). Traffic conflicts and their contextual factors when riding conventional vs. electric bicycles. Transportation Research Part F: Traffic Psychology and Behaviour, 46, Part B, 477–490. DOI: http://doi.org/10.1016/j.trf.2016.06.010
47 Popovich, N., Gordon, E., Shao, Z., Xing, Y., Wang, Y., & Handy, S. (2014). Experiences of electric bicycle users in the Sacramento, California area. Travel Behaviour and Society, 1(2), 37–44. DOI: http://doi.org/10.1016/j.tbs.2013.10.006
48 Prati, G., Marín Puchades, V., & Pietrantoni, L. (2017). Cyclists as a minority group? Transportation Research Part F: Traffic Psychology and Behaviour, 47, 34–41. DOI: http://doi.org/10.1016/j.trf.2017.04.008
49 RAI, & BOVAG. (2022). Fietsen in de Statistiek 2007–2021—Nederland [Bicycle statistics 2007-2021 Netherlands]. https://www.bovag.nl/BovagWebsite/media/BovagMediaFiles/Cijfers/2022/Fietsverkoopstatistieken-2007-2021.pdf
50 Ravensbergen, L., Buliung, R., & Laliberté, N. (2020). Fear of cycling: social, spatial, and temporal dimensions. Journal of Transport Geography, 87, 102813. DOI: http://doi.org/10.1016/j.jtrangeo.2020.102813
51 Rérat, P. (2021a). Cycling to work: an analysis of the practice of utility cycling. Springer Nature. DOI: http://doi.org/10.1007/978-3-030-62256-5
52 Rérat, P. (2021b). The rise of the e-bike: towards an extension of the practice of cycling? Mobilities, 16(3), 423–439.
53 Sanders, R. L. (2015). Perceived traffic risk for cyclists: the impact of near miss and collision experiences. Accident Analysis & Prevention, 75, 26–34. DOI: http://doi.org/10.1016/j.aap.2014.11.004
54 Schepers, P., de Geus, B., van Cauwenberg, J., Ampe, T., & Engbers, C. (2020). The perception of bicycle crashes with and without motor vehicles: which crash types do older and middle-aged cyclists fear most? Transportation Research Part F: Traffic Psychology and Behaviour, 71, 157–167. DOI: http://doi.org/10.1016/j.trf.2020.03.021
55 Schepers, P., Fishman, E., Den Hertog, P., Wolt, K. K., & Schwab, A. L. (2014). The safety of electrically assisted bicycles compared to classic bicycles. Accident Analysis & Prevention, 73, 174–180. DOI: http://doi.org/10.1016/j.aap.2014.09.010
56 Shinar, D., Valero-Mora, P., van Strijp-Houtenbos, M., Haworth, N., Schramm, A., De Bruyne, G., Cavallo, V., Chliaoutakis, J., Dias, J., & Ferraro, O. E. (2018). Under-reporting bicycle accidents to police in the COST TU1101 international survey : Cross-country comparisons and associated factors. Accident Analysis & Prevention, 110, 177–186. DOI: http://doi.org/10.1016/j.aap.2017.09.018
57 Slovic, P., Finucane, M. L., Peters, E., & MacGregor, D. G. (2004). Risk as analysis and risk as feelings: some thoughts about affect, reason, risk, and rationality. Risk Analysis, 24(2), 311–322. DOI: http://doi.org/10.1111/j.0272-4332.2004.00433.x
58 Spotswood, F., Chatterton, T., Tapp, A., & Williams, D. (2015). Analysing cycling as a social practice: an empirical grounding for behaviour change. Transportation Research Part F: Traffic Psychology and Behaviour, 29, 22–33. DOI: http://doi.org/10.1016/j.trf.2014.12.001
59 Van Cauwenberg, J., Clarys, P., De Bourdeaudhuij, I., Ghekiere, A., de Geus, B., Owen, N., & Deforche, B. (2018). Environmental influences on older adults’ transportation cycling experiences: a study using bike-along interviews. Landscape and Urban Planning, 169, 37–46. DOI: http://doi.org/10.1016/j.landurbplan.2017.08.003
60 Van Cauwenberg, J., de Geus, B., & Deforche, B. (2018). Cycling for transport among older adults: health benefits, prevalence, determinants, injuries and the potential of e-bikes. In Geographies of Transport and Ageing (pp. 133–151). Palgrave Macmillan, Cham. DOI: http://doi.org/10.1007/978-3-319-76360-6_6
61 Velosuisse. (2022). Marché suisse de la bicyclette 2021 [Swiss market for bicycles 2021]. https://www.velosuisse.ch/wp-content/uploads/2022/f03/2021_Veloverkaufsstatistik_Schweizer_Markt.pdf
62 Ville de Lausanne. (2020). Observatoire de la mobilité lausannoise : Indicateurs de suivi de la mobilité, Edition 2020 [Measures of mobility in Lausanne 2020 edition]. https://www.lausanne.ch/vie-pratique/mobilite/mobilite-douce-et-trafic/observatoire-mobilite.html
63 von Stülpnagel, R., & Binnig, N. (2022). How safe do you feel? – A large-scale survey concerning the subjective safety associated with different kinds of cycling lanes. Accident Analysis & Prevention, 167, 106577. DOI: http://doi.org/10.1016/j.aap.2022.106577
64 Von Stülpnagel, R., & Lucas, J. (2020). Crash risk and subjective risk perception during urban cycling: evidence for congruent and incongruent sources. Accident Analysis & Prevention, 142, 105584. DOI: http://doi.org/10.1016/j.aap.2020.105584
65 Wang, K., & Akar, G. (2018a). The perceptions of bicycling intersection safety by four types of bicyclists. Transportation Research Part F: Traffic Psychology and Behaviour, 59, 67–80. DOI: http://doi.org/10.1016/j.trf.2018.08.014
66 Wang, K., & Akar, G. (2018b). Street intersection characteristics and their impacts on perceived bicycling safety. Transportation Research Record, 2672(46), 41–54. DOI: http://doi.org/10.1177/0361198118801349
67 Watson, M. (2013). Building future systems of velomobility. In Sustainable Practices (pp. 133–147). Routledge. DOI: http://doi.org/10.4324/9780203071052-17
68 Winters, M., Davidson, G., Kao, D., & Teschke, K. (2011). Motivators and deterrents of bicycling: comparing influences on decisions to ride. Transportation, 38(1), 153–168. DOI: http://doi.org/10.1007/s11116-010-9284-y
69 Winters, M., Sims-Gould, J., Franke, T., & McKay, H. (2015). “I grew up on a bike”: cycling and older adults. Journal of Transport & Health, 2(1), 58–67. DOI: http://doi.org/10.1016/j.jth.2014.06.001
70 Wolf, A., & Seebauer, S. (2014). Technology adoption of electric bicycles: a survey among early adopters. Transportation Research Part A: Policy and Practice, 69, 196–211. DOI: http://doi.org/10.1016/j.tra.2014.08.007
71 Zander, A., Passmore, E., Mason, C., & Rissel, C. (2013). Joy, exercise, enjoyment, getting out: a qualitative study of older people’s experience of cycling in Sydney, Australia. Journal of Environmental and Public Health, 2013, Article ID 547453, 6 pages. DOI: http://doi.org/10.1155/2013/547453