1. Introduction and literature
Whilst the origins of e-scooters stretch back to the early 20th century (Mansky, 2019), the widespread phenomena of shared e-scooters in major cities worldwide is far more recent and dates to the early 1990s with the advent of the lithium-ion battery. Shared e-scooter schemes grew rapidly throughout the 2000s, with scooters available for generally short-term rental. Companies separated into those providing either docked scooters (with fixed locations to pick up and park the scooter) or dockless (scooters are tagged by the supplier and can be left anywhere within a defined radius). US cities were early adopters of e-scooters, with parts of Europe following soon after, and shared e-scooters are now available in major cities internationally. In many cities, there are competing suppliers operating in the same locations. The UK has been slower to uptake the new mode. Currently, using privately owned e-scooters on public roads and pavements is illegal in the UK, but they can be used on private land. In July 2020, a series of trials were announced by the Department for Transport via competitive tender. By 2022, there were 32 shared e-scooter schemes under trial in a mixture of cities, towns and local authorities. E-scooters are legal in public areas if they are from a government-approved shared scheme trial in the UK, and there are many restrictions on how and where they can be used. Shared e-scooter users will need to hold a valid driving license (a full or provisional UK licence for categories AM, A, or B includes entitlement for category Q), and wearing a helmet is advised. It is prohibited to use shared e-scooters on the pavement, footpaths and pedestrianised zones, and they can be used on cycle lanes. There is a maximum speed set at 15.5 miles per hour, and some lower limits may be imposed in certain areas by geofencing. E-scooters should be used by one person at a time, and riding under the influence (e.g. drunk) is prohibited (Department for Transport, 2020).
One of the reasons for the delay in introducing e-scooters to the UK has been the mixed set of hypothesised and potential impacts arising from e-scooter use, with many past case studies based in the USA. Some of the benefits include potential for increased accessibility (Smith and Schwieterman, 2018) and improvements to journey time, convenience and practicality in hot weather (Sanders, Branion-Calles, and Nelson, 2020). However, there have been concerns about the safety of both riders and other road space users (Kobayashi et al., 2019, Sikka et al., 2019) and that use of e-scooters may displace more active modes such as walking and cycling (Sanders, Branion-Calles, and Nelson, 2020). Yang et al. (2020) used a meta-analysis approach to understand the e-scooter related incidents and safety concerns. The work (Yang et al., 2020) concludes that the key concerns (risks) in the US are helmet use and riding under the influence. Siman-Tov et al. (2016) investigated a total of 795 patients who were admitted for e-bike and e-scooter-related (private rather than shared) injuries and incidents in Israel, and 8.4% of the Injuries were pedestrians. The hypothesis that e-scooters and other e-micromobility could have negative consequences of reducing physical activity is still disputed in academic and non-academic works (Bozzi, 2021). Glenn et al. (2020) reported that e-scooter has a negative effect on health due to users’ lower level of physical activity. But Jones, Harms, and Heinen (2016) suggested that the overall physical activity effect of switching to e-micromobility remains unclear, with e-micromibility users tend to perceive (self-report) increases in physical activity (Jones, Harms, and Heinen, 2016). Sanders, da Silva Brum-Bastos, and Nelson (2022) concluded that e-scooter use is likely to reduce active travel, but the mode is healthier than driving and replaced some car trips. Hence, the use of e-scooters and its relationship with physical activity is moderated by transportation habits, options, and context (Sanders, da Silva Brum-Bastos, and Nelson, 2022).
Published literature based on empirical evidence from e-scooter use in the UK is still sparse. Some are prospective, covering for example potential impacts from e-scooters prior to the introduction of shared e-scooter schemes (Cottell, Connelly, and Harding, 2021). Studies involving empirical evidence from the UK are predominantly in the medical literature, such as injury patterns from private e-scooter use in London (Cruz et. al, 2021; Rashed, Vassiliou, and Barber, 2022). Two early reports from the trial implementations (Brown, Klein, and Thigpen, 2021; Sherriff et al., 2021) focus on users’ behaviour and attitudes. Brown, Klein, and Thigpen (2021) includes findings from Milton Keynes around misparking and the potential to incentivise correct parking. Sherriff et al. (2021) reports on a mixed sample from Salford, that is, users, undecided potential users and those who would not use scooters. The number of e-scooter users in the sample is low (fewer than 200) and the implementation area is small, but the report gives early evidence that although current use purpose is largely “for fun”, there is a propensity for e-scooters to be incorporated as a mode within regular trips (with male users more so than females).
A large variety of definitions of well-being have been proposed, covering both objective and subjective measures. A comprehensive summary is that by Forgeard et al. (2011), who conclude that “a useful way to convey information on a wide array of subjective and objective indicators is to …. not attempt to reduce well-being to one number, but instead ….. to find ways to present information on a variety of objective and subjective facets of wellbeing” (Forgeard et al., 2011). A number of studies have been concerned with methods to assess well-being impacts from travel in general terms, but are not directly linked to e-scooters. Mokhtarian (2019) gives a broad overview, examining terminology, related concepts and issues in measurement of well-being and travel. Gärling et al. (2020) propose that travel behaviour research should focus more on emotional well-being. The paper reviews and assesses current measurement methods for emotional well-being and argues that the best method is recurrent measures of current mood. For multi-mode and multi-stage journeys, aggregation of point estimates can be used. Gärling et al. (2020) suggests that where retrospective is necessary, an amendment to Ettema’s (2011) satisfaction with travel scale may be used as a standardised retrospective measure of emotional well-being during travel. Chatterjee et al. (2020) propose a conceptual model for well-being related to the commute, but not specifically for e-scooters as a mode. Although a significant number of e-scooter trips are for non-commute purposes, the model proposed by Chatterjee et al. (2020) is a useful, loose framework to investigate e-scooter well-being impacts in response to the research question. The model includes subjective (e.g. stress, eudaimonic) and objective (e.g. time, money) constructs and temporal aspects (i.e. mood during travel, afterwards and long term). It also extends to life objective factors such as life conditions and other modes used by the traveller. With the lack of substantive research in the field, in this study, the nature of well-being impacts is hypothesised based on published findings from other related modes (for example, bicycle). The source of positive e-scooter well-being outcomes are anticipated from a mixture of characteristics including being fun to use, creating accessibility, forming a semi-active mode, exposure to fresh-air and others. Negative well-being impacts from e-scooter use may arise from, for example, the stress of being in traffic, near misses and the need to concentrate on driving and riding skills.
To date, little has been reported on the wider impacts (such as well-being aspects) of e-scooters. The few publications in the public domain comprise reviews rather than analysis of primary data (e.g., Glenn et al., 2020; Milakis et al., 2020). This is the originality and knowledge gap that we contribute towards with the research reported in this paper. The overarching research question is: What are the significant factors underpinning self-reported changes in subjective well-being indicators as a result of e-scooter use? The results will be of interest to policy makers, operators and the general public in informing assessment of the wider costs and benefits of shared e-scooter schemes alongside the core outcomes such as safety, efficiency, environmental and financial factors.
The structure of the paper is as follows. In section 2, we describe the method and analysis approach used to investigate the research question, based on the use of an online survey. The results are presented in section 3, followed finally by conclusions and discussion.
2. Methods
With little other published work in this field, the research started with the hypothesis that well-being impacts from shared e-scooter use could be both positive and negative and that different types of users may have different experiences. The method adopted is a social science approach, based on self-reported well-being via an online questionnaire. This method was chosen to generate early evidence on the direction and nature of impacts in the spirit of a pilot study, which could be the basis of a more formal assessment in future research.
2.1 Online questionnaire to e-scooter users
Based on the literature and drawing on reviews, findings from related modes and the conceptual frameworks (section 1), the well-being related questions were grouped as follows: (a) Feeling less stressed before, during or after a journey and good mood; (b) Subjective changes in activity levels, i.e. feeling more active, cycling less, walking more; (c) Self-reported accessibility and efficiency measures, for example, higher journey time reliability, benefits with respect to journey cost; and (d) perceived environmental impacts concerning local air quality and personal safety. A range of independent variables were asked, including basic demographic information (e.g., age category, gender, ethnicity group, household income, education level as examples). Respondents also voluntarily provided information on their frequency of e-scooter use, mobility (ability to walk for approximately 400 metres), their access to other modes and trip purpose by category. The wording in the questionnaire for these variables is presented in Appendix 1. The questionnaire as a whole included a wider set of questions concerning mode switch, journey purpose and journey characteristics that will form the basis for a further paper. The questionnaire was developed using Jisc online survey software, and ethical approval was granted by the University of Leeds ethics committee.
The online questionnaire was delivered to potential respondents in the Voi e-scooter suppliers’ database of registered users on August 2021 and who had agreed to receive messaging on initial registration to use the scooters. Participants were offered entry to a prize draw to acknowledge the time and inconvenience of taking part, with prizes of e-shopping vouchers, helmets and scooter use credits. A total of 2,402 responses were received during the one-month period that the survey was live (August to September 2021). The data included respondents from 15 cities and towns in the UK and includes first-time users, occasional users (1–3 rides per month), regular users (4–6 rides per month) and frequent users (6+ rides per month). All well-being questions were reported using a five-point Likert scale ranging from strongly disagree to strongly agree.
The 15 UK cities and towns where respondents were located are as follows: Bath, Birmingham, Bristol, Cambridge, Corby, Coventry, Higham Ferrers, Kettering, Liverpool, Northampton, Oxford, Peterborough, Portsmouth, Southampton, and Wellingborough. Different no-ride and slow-ride zones were implemented in these cities and towns to ensure that riding occurs in relatively safe and monitored areas.
2.2 Analysis method for questionnaire responses
The dependent variables used in the questionnaire were presented on a five-point Likert scale, that is (1) Strongly disagree, (2) Disagree, (3) Neither agree nor disagree, (4) Agree, and (5) Strongly agree. To capture and utilise the explicit ordering information in the answers, an Ordinal Logistic Regression (OLR) model (Harrell, 2015) was used to reveal the relationships between independent variables (e.g. socioeconomic features) and the dependent variables. The latter included a range of categorical data (ordinal responses) to reflect self-reported well-being and established proxies for well-being, such as access to green space. There are a number of previous examples of the application of OLR models in analysing the quality of life, well-being and transportation survey data, including research on subjective well-being (Soukiazis and Ramos, 2016), quality of life (Abreu et al., 2008) and perception of travelling (Almannaa et al., 2021). A summary of the general formulation of the Ordinal Logistic Regression is provided in Appendix 2, however to make clear the modelling results presented, it should be noted that the interpretation of the odds ratio (OR) in OLR is:
OR = 1 indicates that the independent variable does not affect the odds of the outcome;
OR > 1 indicates respondents are more likely to state a level of agreement “J” on the scale than a level of agreement J – 1;
OR < 1 indicates respondents are less likely to state a level of agreement “” on the scale than a level of agreement J – 1.
In this research, relatively low frequencies of “Strongly disagree” responses are observed in a number of questions (introduced in section 3.2). Therefore, the adjacent “Strongly disagree” and “Disagree” are collapsed (Ball et al., 2010) as “Disagree or Strongly disagree” in the OLR model to improve the asymptotic approximations in the analysis (Murad et al., 2003; Crane et al., 2016). Separate OLR models were built to model the relationships between independent and dependent variables. Different models may have varying independent variables to avoid potential impacts of self-casuality. For example, “have fun” (independent) was dropped in modelling “in a good mood” (dependent). The details of variable choices are shown in section 3.3, along with the results. All OLR models are carefully examined with the Brant test (Brant, 1990), which is anti-conservative (Branton et al., 2011) in detecting violations of the assumption of proportional odds (Liu & Koirala, 2012). The Brant test results and other goodness of fit statistics are in Appendix 2.
The models were applied using R language and the MASS package, with the OR and p-value (i.e., the probability under the null hypothesis that the model parameters are zero) used to indicate the association and significance of independent variables. Results are presented and discussed in the following section.
3. Results
3.1. Overview of the sample characteristics
We begin with a summary of the basic demographic and socioeconomic characteristics of the e-scooter users who responded, including behaviour related to e-scooter usage. The percentage values of each variable and categories within are shown in Table 1.
Demographic, socioeconomic characteristics, and frequency of e-scooter use.
| Variable | Categories | n | % |
|---|---|---|---|
| Age band | 18–30 years | 1144 | 47.6 |
| 31–40 years | 649 | 27 | |
| 41–60 years | 525 | 21.9 | |
| 61+ years | 54 | 2.3 | |
| Prefer not to say | 30 | 1.2 | |
| Gender identity | Female | 826 | 34.4 |
| Male | 1513 | 63 | |
| Prefer not to say | 63 | 2.6 | |
| Ethnicity | White | 1960 | 81.6 |
| BAME | 369 | 15.4 | |
| Prefer not to say | 73 | 3 | |
| Long-term illness that limits daily activities or work | Yes | 243 | 10.1 |
| No | 2095 | 87.2 | |
| Prefer not to say | 64 | 2.7 | |
| Any difficulty walking for a quarter of a mile? | Yes | 99 | 4.1 |
| No | 2236 | 93.1 | |
| Prefer not to say | 67 | 2.8 | |
| Educational attainment | No formal qualifications | 56 | 2.3 |
| Level 1 and 2 (e.g. GCSE’s, O Levels) | 264 | 11 | |
| Level 3 (e.g. A Levels, BTEC) | 554 | 23.1 | |
| Level 4 (e.g. University Degree) or higher | 1403 | 58.4 | |
| Prefer not to say | 125 | 5.1 | |
| Employment status | Employed | 1733 | 72.1 |
| Self-employed | 244 | 10.2 | |
| Unemployed | 90 | 3.7 | |
| Full-time student/pupil | 209 | 8.7 | |
| Not working (Others) | 45 | 1.9 | |
| Prefer not to say | 81 | 3.4 | |
| Social Grade (UK National Statistics Socio-economic classification, NS-SEC) | AB | 379 | 15.8 |
| C1 | 1285 | 53.5 | |
| C2 | 266 | 11.1 | |
| DE | 203 | 8.4 | |
| Prefer not to say | 269 | 11.2 | |
| Cars available to household | Have car(s) | 1781 | 74.1 |
| No cars | 550 | 22.9 | |
| Prefer not to say | 71 | 3 | |
| Annual household income (AHI) | Less than £15,000 | 248 | 10.3 |
| £15,000–£24,999 | 322 | 13.4 | |
| £25,000–£37,499 | 389 | 16.2 | |
| £37,500–£49,999 | 321 | 13.4 | |
| £50,000–£74,999 | 351 | 14.6 | |
| £75,000–£99,999 | 213 | 8.9 | |
| Over £99,999 | 173 | 7.2 | |
| Prefer not to say | 385 | 16 | |
| How regularly have you used e-scooters? | One time only | 557 | 23.2 |
| Occasionally (1–3 times a month) | 1013 | 42.2 | |
| Regularly (4–6 times a month) | 356 | 14.8 | |
| Frequently (more than 6 times a month) | 476 | 19.8 | |
The youngest age group (age 18–30) consists of the highest proportion (47.6%) in the survey, with 2.2% of respondents aged over 61. These are overall consistent with other e-scooter studies, for example, Almannaa et al. (2021) reported 2% of users (surveyed sample) are 61 and older in Riyadh, Saudi Arabia. In the work of Gioldasis, Christoforou and Seidowsky. (2021), 63% of respondents are between 18–30 in Paris, higher than the figure in this work (47.6%).
There is also an evident higher proportion of males (63%) and users having good educational attainment, with 58.4% having at least a level 4 degree (higher education or equivalent). The proportion with no educational qualifications is 2.3%, compared with a 2018 national average figure of 9% (details of UK qualification levels in the Appendix 3). In the sample, those reporting no educational qualifications were generally in the higher age categories. This may be attributable to the relationship between age and educational achievement, with more younger people having a degree.
The results show that 10.1% of the respondents have a long-term illness, which limits daily activities or work (Limiting long-term illness, LLTI), and 4.1% consider themselves to have difficulties in walking for one-quarter mile (approximately 400 metres). The majority (42.2%) of participants are occasional users who use e-scooter 1–3 times a month; this is followed by one-time only users (23.2%). Interesting, this survey attracted a slightly higher percentage of frequent e-scooter users (19.8%) than regular users (14.8%). The survey not only attracted frequent users but also those who are not more likely to be in favour of the scheme. Some of the one-time only and occasional users may not be familiar with the scheme or do not consider e-scooter as an attractive travel model that well fits their needs. Qualitative feedback using open ended questions was also collected alongside the quantitative/ordinal responses, and people used this survey to express their suggestions and experience (both positive and negative).
Overall, respondents’ demographic and socioeconomic profile is consistent with other micromobility studies (Fitt & Curl, 2019; Christoforou et al., 2021) and real-world scheme users, although it is worth noting there is little published evidence directly from the UK schemes to compare. Other micromobility studies reported users were more likely to be young, well-educated, affluent males (Beecham and Wood, 2014; Bozzi and Aguilera, 2021; Laa and Leth, 2020; Lovelace et al., 2020; Reck and Axhausen, 2021). An interesting characteristic of this sample is the proportion of users with long-term illness or mobility issues.
3.2 Response to questions
3.2.1. Trip purpose, origins and destinations
Respondents were initially asked about the rationale for choosing an e-scooter on their last trip (Think back to your last e-scooter trip. Why did you choose to ride an e-scooter?), with the possibility of choosing more than one response. In Figure 1, the percentage selecting each reason for e-scooter use is calculated using the number of responses divided by the number of survey participants. The top two reasons are “save time” and “have fun” (Figure 1), and they are consistent with the work of Christoforou et al. (2021), where Paris e-scooter users consider “travel time” and “playfulness” are the top two major motivations (Christoforou et al., 2021). In Figure 1, notable outcomes include the wish to avoid using public transport and the 8.2% of responses wishing to avoid travelling with others for health and hygiene reasons. In the context of the COVID-19 pandemic, some users consider e-scooter a safer and healthier travel mode and helps reduce the risk of getting close proximity to others.
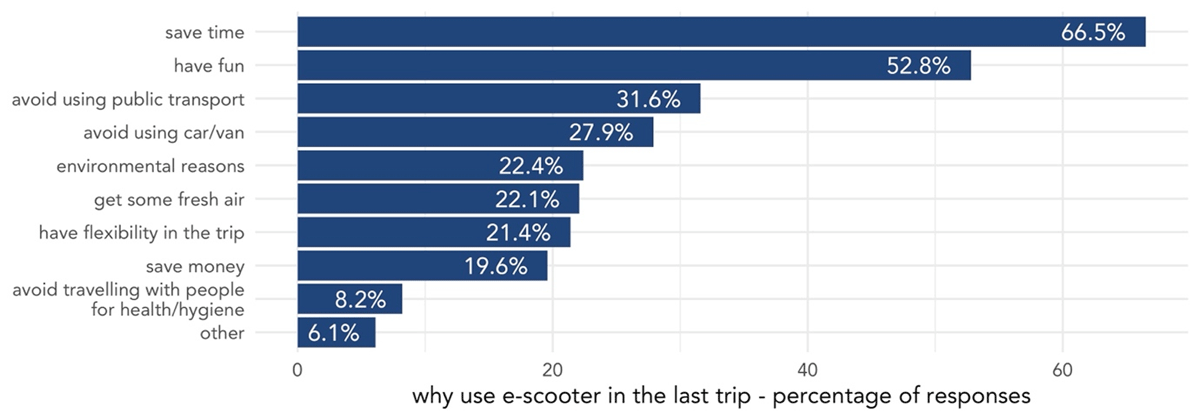
Response to “Why did you choose to ride an e-scooter on your last trip?”
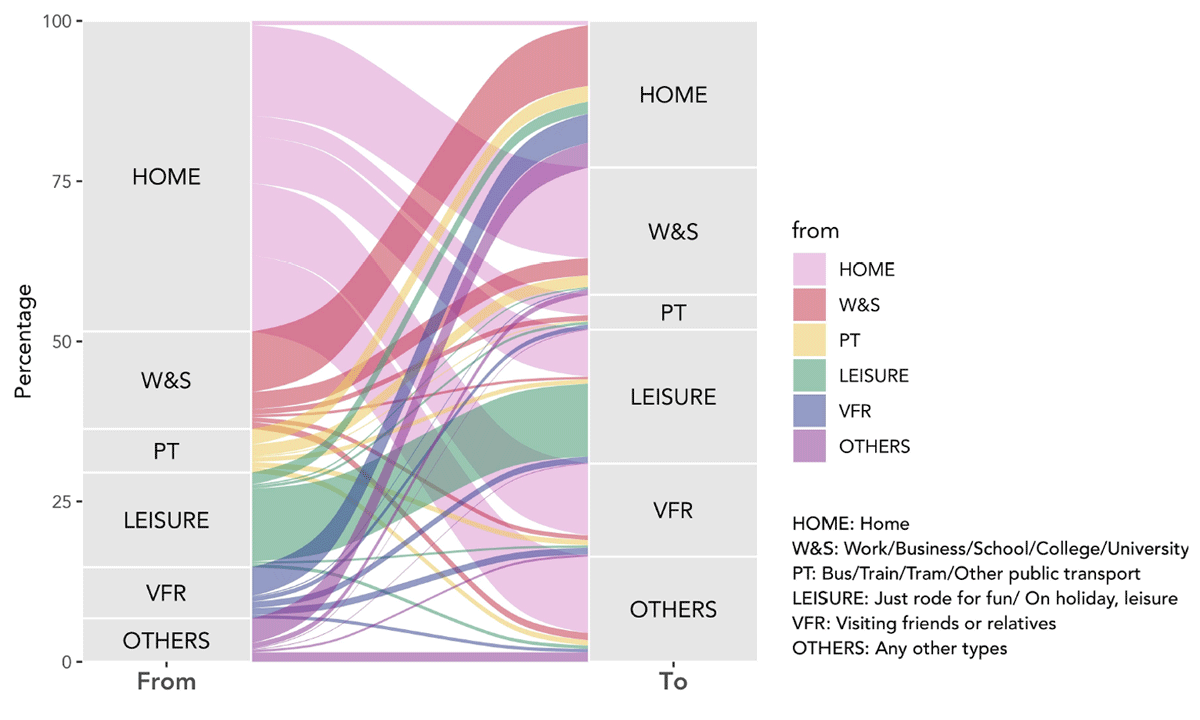
Figure 2 (Sankey plot) illustrates the origin and destination pairs of the last scooter trip, and the exact proportions are indicated in Table 2. Respondents were able to choose more than one origin or destination to indicate trip chaining, and the question asked only about the e-scooter part of the journey. For clarity, we represent the data for one origin and one destination only in Figure 2 and Table 2, which comprised 1,701 responses or 71% of respondents. The dominant origin is clearly home, and home, work/business/education, and leisure destinations had very similar proportions of response, in the range of 19–23%.
Trip origin and destination types.
Proportion of Trip origin and destination types.
| Destination | ||||||||
|---|---|---|---|---|---|---|---|---|
| % | HOME | W&S | PT | LEISURE | VFR | OTHERS | Total | |
| Origin | HOME | 0.65 | 14.11 | 3.17 | 7.35 | 11.23 | 11.93 | 48.44 |
| W&S | 9.47 | 2.70 | 0.82 | 0.41 | 0.71 | 1.12 | 15.23 | |
| PT | 2.47 | 1.82 | 0.18 | 0.71 | 0.82 | 0.82 | 6.82 | |
| LEISURE | 1.88 | 0.24 | 0.41 | 11.35 | 0.35 | 0.53 | 14.76 | |
| VFR | 4.53 | 0.18 | 0.71 | 1.00 | 1.06 | 0.53 | 8.00 | |
| OTHERS | 3.88 | 0.82 | 0.12 | 0.12 | 0.35 | 1.47 | 6.76 | |
| Total | 22.87 | 19.87 | 5.41 | 20.93 | 14.52 | 16.40 | 100.00 | |
HOME: Home; W&S: Work/Business/School/College/University; PT: Bus/Train/Tram/Other public transport; LEISURE: Just rode for fun/On holiday, leisure; VFR: Visiting friends or relatives; OTHERS: Any other types.
In the following sections (3.2.2–3.2.5), we investigate e-scooter related changes in subjective well-being change, physical activity and other wider questions on accessibility. For each, a summary of responses is given, followed by fitting OLR models on several key questions (section 3.3).
3.2.2. Changes in feelings of stress and wider well-being
Two groups of questions were used to explore changes in firstly personal stress levels (before, during and after the journey) and secondly, some wider indicators of well-being (mood, energy, feeling closer to nature). With the same question format: “As a result of using e-scooters I’ve noticed the following”, the summary responses are shown in Figure 3.
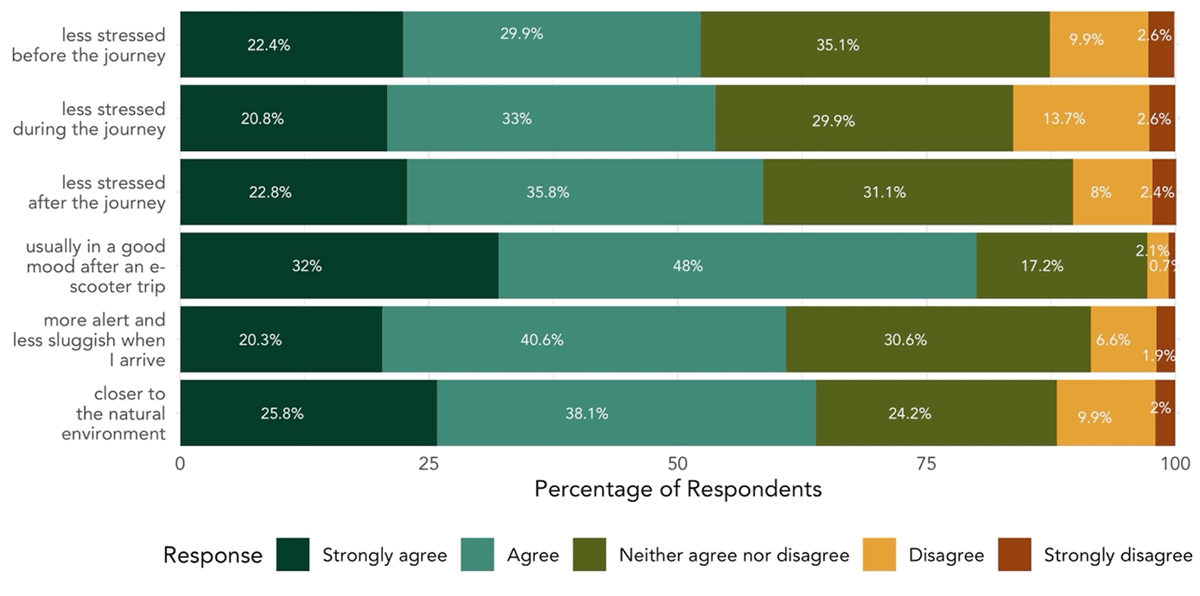
Summary responses to questions concerning feelings of stress and other well-being indicators.
In Figure 3, a very noticeable tendency for e-scooter users to usually feel good after an e-scooter trip is seen, with 80% of respondents agreeing or strongly agreeing. The results show 63.9% agreed or strongly agreed that they felt closer to the natural environment, a well-established indicator (Nisbet, Zelenski and Murphy, 2011) of well-being from research in other fields.
The lowest level of agreement was towards the statement that as a result of using e-scooters the participants felt less stressed before the journey. This aligns with the sense that the impacts of e-scooter use are largely incurred during the use of the mode (Chatterjee et al., 2020).
3.2.3. E-scooter trips and accessibility changes
E-scooters can help to increase accessibility by providing a flexible urban travel mode. Respondents were asked about four indicators of accessibility, access to local services and amenities, the speed and reliability of journeys, and the costs involved, using the following question: “Since I’ve been using e-scooters, the following have improved”. The results show 56.5% agreed or strongly agreed that access to local services and amenities had improved. Users also report benefits from higher journey speeds and increased journey reliability compared with alternative modes (e.g., walking or congested motorised travel (Figure 4). The feeling of “increased reliability” (“self-efficacy” and “control”) in mobility and travelling is an important component of psychological well-being and life satisfaction (LaJeunesse & Rodríguez, 2012; Woodward & Wild, 2020). Almost half (49%) reported cost-related benefits in travelling.
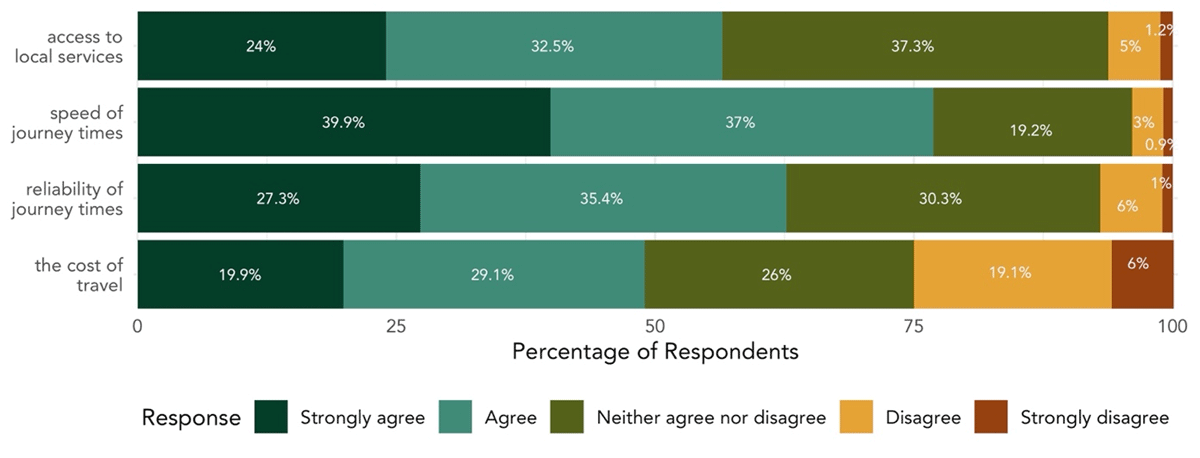
Survey results on various benefits in accessibility, journey time and cost brought by e-scooter.
3.2.4. E-scooter use and subjective changes in activity levels
E-scooters are sometimes advertised as an “effort-free” transport mode, which may imply that their use offers few, if any fitness benefits (Glenn et al., 2020). There is a long-standing hypothesis (Bozzi and Aguilera, 2021) that e-scooter use may lead to negative outcomes in terms of physical activity, especially if walking and cycling journeys are replaced by e-scooter use. This survey included several questions related to physical activities, and results are shown in Figure 5.
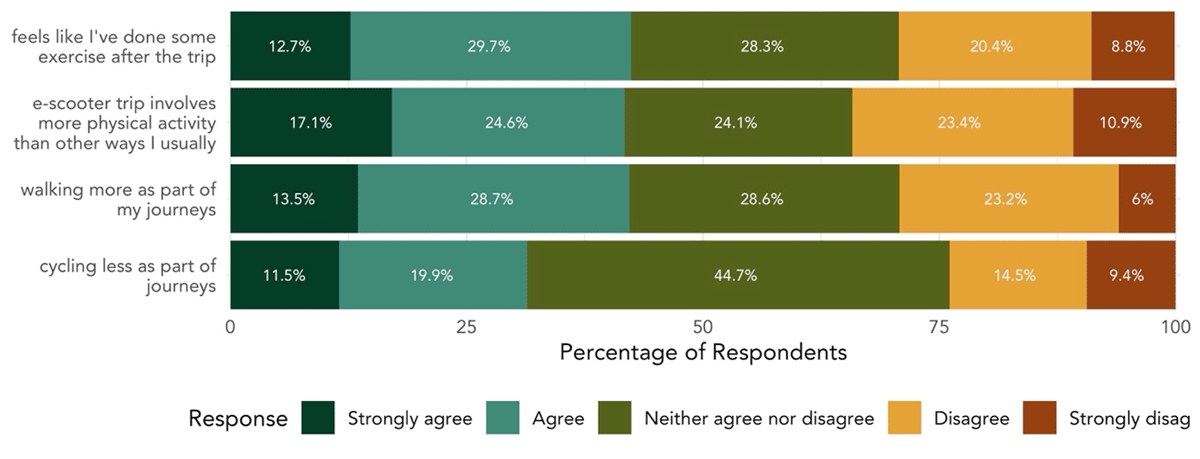
E-scooter use and self-reported physical activity.
42.4% of respondents strongly agreed or agreed that e-scooter is not completely “effort-free”, and they feel like they have done some exercise after the e-scooter trip, whilst only 29.2% reported that they disagreed with the statement. However, it is important to note that this is a perception rather than based on measured activity.
There are also more people who consider themselves to be walking more, but cycling less, as part of the e-scooter journey. Overall, respectively 17.1% and 24.6% of participants strongly agree and agree that e-scooter trip “involves more physical activity than other ways I usually travel”. They are higher than the proportion of people who disagree or strongly disagree. We can not completely disentangle the relationship between scooter use and walking or cycling because our statements were framed around walking more or cycling less.
3.2.5. Safety and air quality concerns
Two questions about personal safety and air quality were asked to detect the likelihood of negative well-being outcomes from e-scooter use. Respondents were again asked to respond on the Likert scale to the statement “as a result of using e-scooters I’ve noticed the following”: “air quality doesn’t feel good in my e-scooter trip”, and “I’m nervous about my safety when using and e-scooter”.
Safety concerns could impede people’s willingness of e-scooter (Fitt & Curl, 2019; Kopplin et al., 2021). Figure 6 suggested a higher level of agreement or strong agreement to the statement on safety concerns variable than that of air quality. Perceived safety and air quality are also associated with the local context (e.g. low-speed travel infrastructures, air pollutants, crime rates in different areas and cities) and purpose of use (Useche et al., 2022). In the UK, e-scooters are not allowed to be used on pavement, footpath and pedestriansed zones. Therefore, when replacing walking trips, e-scooter users need to change the routes or the infrastructure (different types of road) they use.
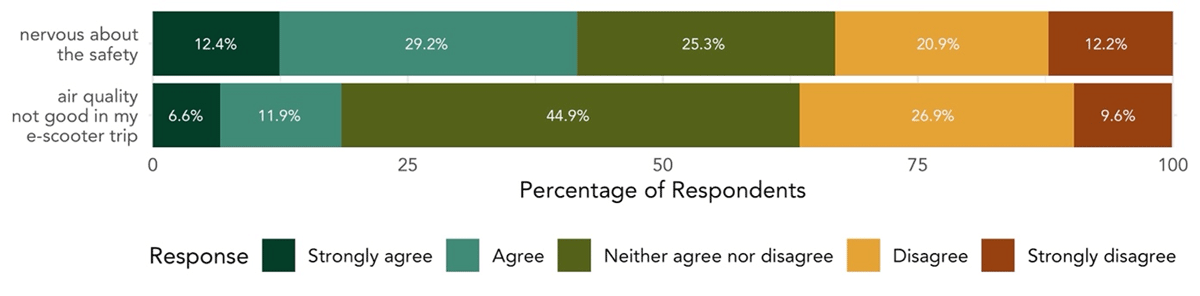
Safety and air quality hazards concerns.
3.3 OLR results on subjective well-being
This study further investigated the relationship between e-scooter use and subjective well-being changes. Hence, the following key questions (listed in Table 3) that are closely related to subjective well-being are chosen to fit OLR models and the results are shown and interpreted in this section.
Key Questions that are chosen to fit the OLR model.
| Group | Question |
| Stress level | Feeling less stressed during the journey if use e-scooter? |
| Feeling less stressed after the journey | |
| Feelings and wider well-being | I’m usually in a good mood after an e-scooter trip |
| Feeling closer to the natural environment with e-scooter | |
| Feeling less sluggish when I arrive using e-scooter | |
| Accessibility | Accessibility to services and amenities has improved with e-scooter |
| Reliability of journey time has improved with e-scooter | |
3.3.1 Stress level
Section 3.2.2 indicated that the impacts of e-scooter use on stress levels are mainly incurred during the use, and could happen immediately after the journey (Chatterjee et al., 2020). Therefore, the relationships between the two questions (periods) and the independent variables are examined by fitting OLR models, respectively. The key results concerning the odds ratios and p-values are shown in Figure 7, and other statistics (cutoff values, goodness of fit statistics) are provided in Appendix 2. In Figure 7 (and similar figures in the following sections), the vertical axis contains the set of independent variables, and the odds ratio obtained by fitting the model forms the horizontal axis. Shapes are used to represent each of the specific question, and the colour assigned is the probability of the null hypothesis that the parameter coefficients are zero being true. Those variables shaded yellow, orange or red therefore represent a statistically significant result (p-value smaller than 0.05). In model fitting, a reference category is used for each variable and doesn’t appear in the figure; hence for ethnicity, the likelihood relative to BAME (Black, Asian and minority ethnic) groups is reported. The odds ratio may be interpreted such that an odds ratio larger than one reflects respondents are more likely to state a level of agreement “J” in the scale than a level of agreement J – 1; in other words, it implies that respondents with the independent characteristic are more likely to agree with the statement about reduced stress level with e-scooter use. A less than one odds ratio similarly means respondents are less likely to agree.

Ordinal logistic regression results of stress level and well-being.
From Figure 7, people who are more restricted in mobility are more likely to feel less stressed after the e-scooter trip. For those with walking difficulties (for more than a quarter of a mile, approximately 400 meters), the odds of being more likely to feel less stressed (after) is 1.62 times as participants who do not have walking difficulties. Similarly, people without cars also reported a higher odds ratio at 1.22 of feeling less stressed after the journey.
“Get fresh air” were significantly more likely to feel less stressed both during and after the trip, where the odds ratios are 1.69 and 1.56, respectively. Working people and students tend to benefit from less stress while riding e-scooters. Similar relationships were found in people of lower educational attainment (Level 1, 2 and below) and income (annual household income between £ 15,000 and £24,999).
3.3.2 Feelings and wider well-being
To avoid the reverse causality problem, not all models have utilised the same group of independent variables. The purpose of “have fun” is dropped when modelling the relationship between input features and “in good mood” (dependent). Hence, the round symbol (in Figure 8) does not occur in the horizontal line of “have fun”. Similarly, “Environmental reasons” and “Get fresh air” are dropped when modelling “Feel closer to nature”.
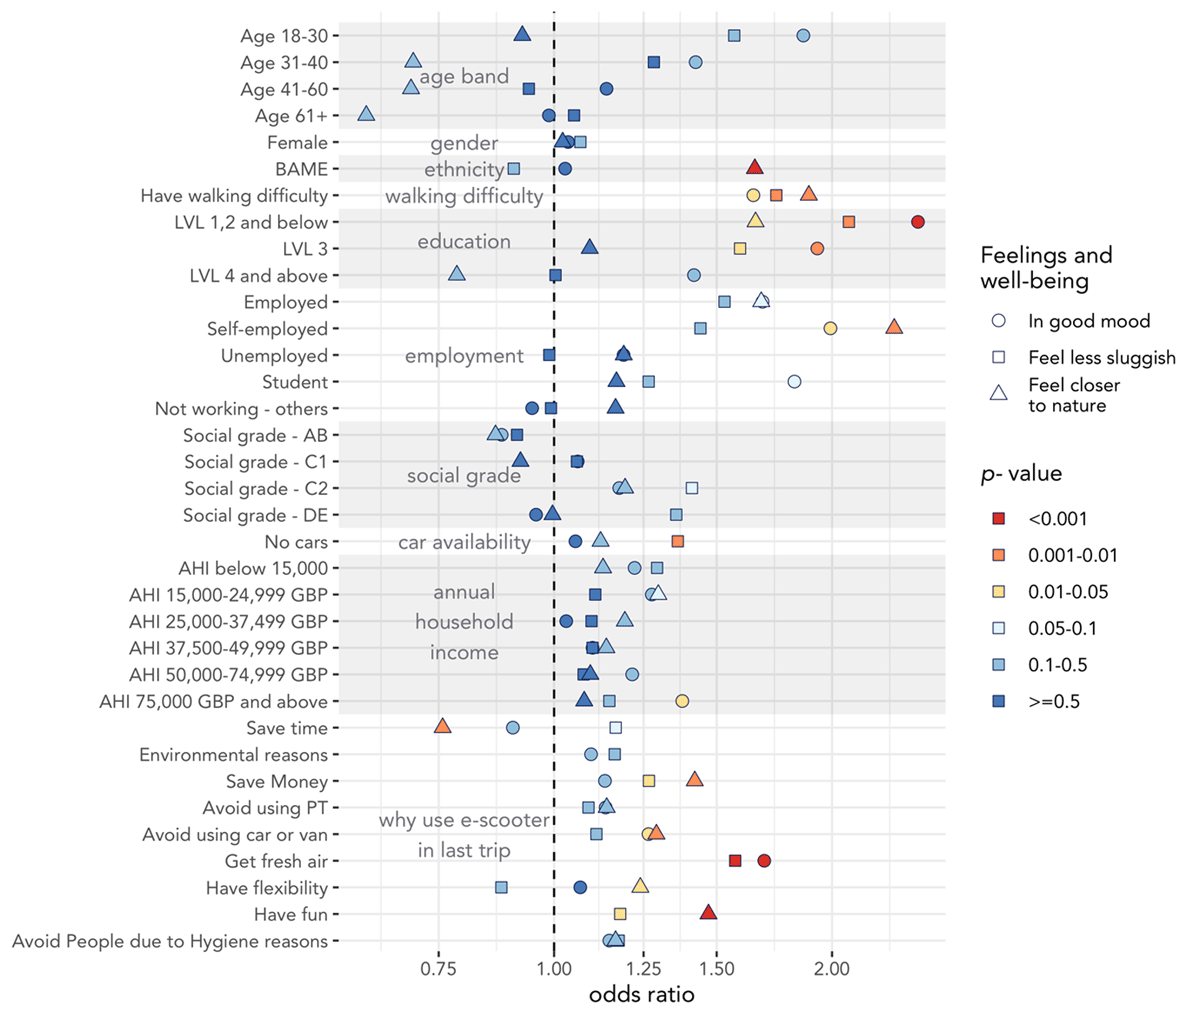
Ordinal logistic regression results of feelings and wider well-being.
Figure 8 indicates that people with walking difficulties are significantly more likely to agree with all three wider well-being impact types (good mood, less sluggishness and feeling closer to nature), with odds ratio ranging from 1.64 to 1.89. The ethnic minority groups (BAME) tended to agree (odds ratio of 1.65) they felt closer to nature, which is an important proxy of well-being (Ballas & Tranmer, 2012). Those with lower qualifications were significantly more likely to agree they experienced all three wider well-being outcomes from e-scooter use. Those users who were using an e-scooter to save time were significantly less likely to agree they felt closer to nature.
3.3.3 Feelings about accessibility and travel time reliability
The feeling of “self-efficacy” and “control” in mobility and travelling helps improve psychological well-being and life satisfaction (LaJeunesse & Rodríguez, 2012; Woodward & Wild, 2020). Therefore, two closely related questions (Figure 9) are examined by fitting OLR models, respectively. Decisions were also made to eliminate the impact of reverse causality: “Save time” was dropped in both models, and “Have flexibility” was removed when fitting the model of “Higher time reliability” (Figure 9).
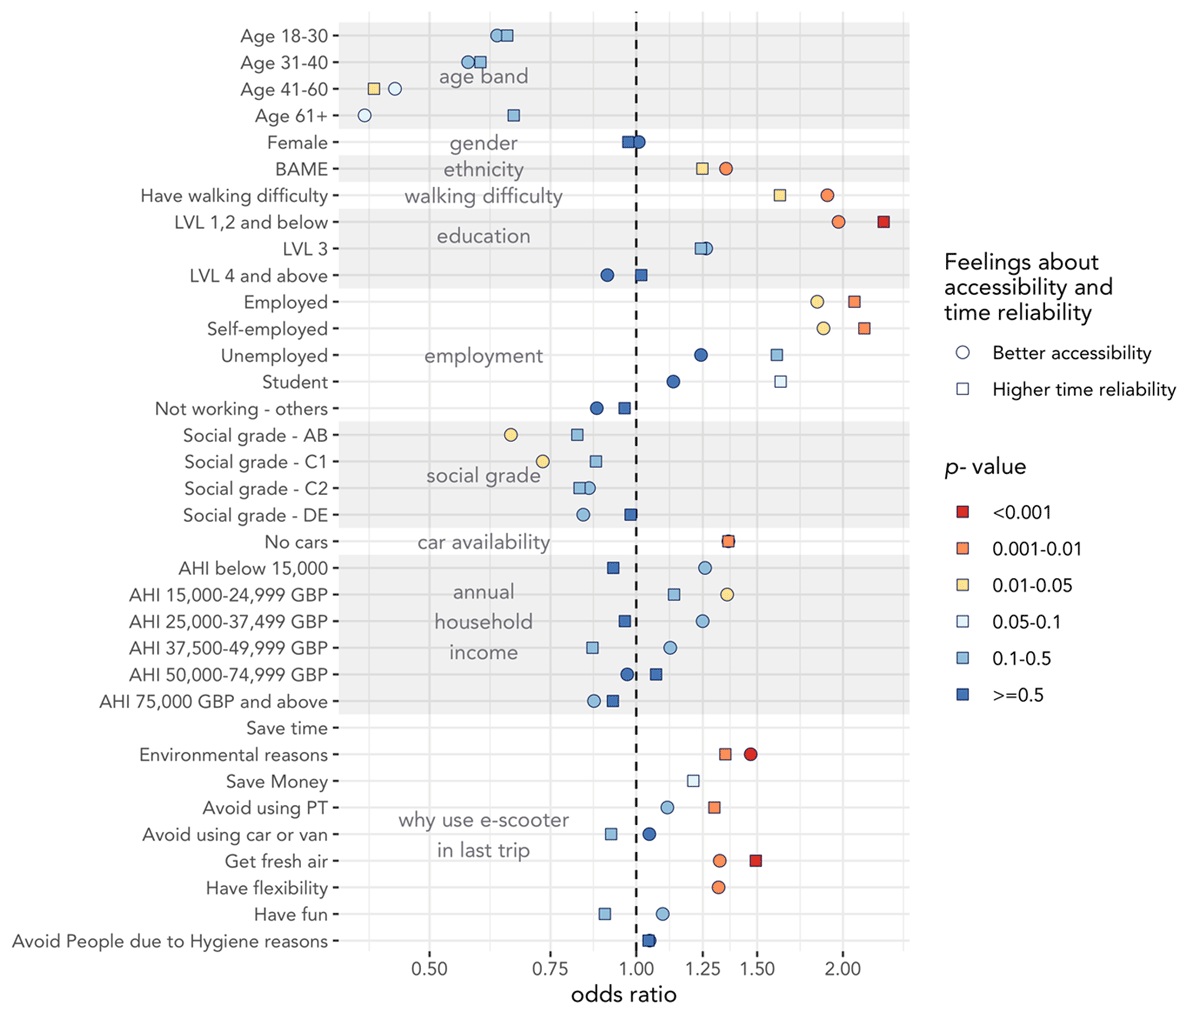
Ordinal Logistic Regression results of feelings about accessibility and travel time reliability.
From Figure 9, it is apparent that a number of subgroups in the pool of respondents were more likely to report significant improvements as a result of e-scooter use, in particular those with the following characteristics: BAME, those with walking difficulties, lower educational attainment, economically active, and those with no cars in their households.
4. Conclusions and discussion
Although a substantial body of research has been conducted into some of the impacts of e-scooter use, for example on safety issues, the literature around a wider set of impacts including well-being is much more sparse. Due to the very recent introduction of shared e-scooter schemes in the UK, this paper has particular novelty in reporting preliminary perceived well-being outcomes from shared e-scooter use in the UK. Building on a framework for a social science approach to self-reporting of well-being, the results are not intended to reflect a clinical assessment of mental health. However, the findings at the level of summary trends and Ordinal Logistic Regression modelling have consistency. Those users with protected characteristics, i.e. ethnic minority, those with lower educational outcomes, mobility issues, and who do not have cars are more likely (higher odds ratio) to agree on well-being benefits according to responses on the Likert scale. 2.3% of respondents are aged 61 or older, although a relatively small proportion, it is interesting to note that the age range extends to this older group, given (media) stereotypes of e-scooters as this mode is only used by younger groups. For example, the work of Bieliński & Ważna (2020) reported no e-scooter sharing users in their survey aged over 61.
The strengths of the study arise from the large sample of complete responses obtained with a relatively lengthy questionnaire, allowing analysis to consider a wide number of variables and determinants which have not been considered in related work, such as individuals’ health status. A high proportion of respondents gave permission for the research to link their questionnaire responses to their empirical individual e-scooter trip data. This will exploration of further characteristics such as time of departure by demographic and differences in route choice. It will also allow analysis by the geographies involved, such as whether responses vary significantly by location within the UK and the extent to which the demographic varies by location. There are inevitably constraints on the work presented here, including a lack of validation or comparator data, largely due to the early stage of the e-scooter trials in the UK overall. Because registration to use a shared e-scooter requires ICT (information and communications technology) access, the issue of bias against non-digital users that arises with other online questionnaires is not a factor here. However, the users surveyed are from a single suppliers’ database and the extent to which this is representative of the experience of all shared e-scooter users is unknown.
This research focused on e-scooter’s users’ use and their subjective well-being, while the wider impacts on the whole transport and urban system are not investigated. The synergies and trade-offs between e-scooter users and other travel modes/people (car drivers, pedestrians) are beyond the scope of this research. Future work on this interesting topic might provide a comprehensive picture of the whole urban transport system and urban inhabitants.
Respondents reported a higher proportion of agreeing that e-scooter involves more physical activities, but the links between e-scooters and physical activity are not thoroughly explored in this work, since the focus of this research is the subjective well-being and e-scooter use. Future work may study the relationship by looking into the reasons for doing more physical activity. It should be noted that the use of e-scooter may not only directly leads to more physical activities, in the long-term, this new type of micromobility might also promote infrastructure changes (Bozzi and Aguilera, 2021) and attracting more investments into creating a better environment and culture for facilitating various low speed and active travel mode, such as cycling and walking. There is also a potential bias in the “cycling less” responses, since the other questions (e.g. “walking more” and “more physical activity”) are for positive effects, while the “disagree” and “strongly disagree” with “cycling less” is not entirely clear does it mean “I am cycling more” or “I am cycling the same”. Therefore, the negative effect on cycling is not fully captured in the questionnaire. The outcome of cycling less due to use of the e-scooter can, however, be detected by analysis of associated questions collected in the questionnaire which, due to space limitations, are not reported here. These concern mode switch and in particular, participants were asked to indicate a switch from other modes including more active modes such as walking and cycling in their last journey and journeys in the previous month. That analysis will form part of a subsequent paper. More generally, although many of the questions have a positive orientation, e.g., ‘feeling less stressed’, other questions that have a negative orientation include those related to air quality and personal safety e.g ‘I’m nervous about my safety’. Due to the length of the survey and considering user response burden, it wasn’t possible to fully balance the number of positive and negative orientated questions. The survey does not fully capture all the variance in the questions of gender. Binary gender options were provided to keep consistency with open UK census data. Although a “prefer not to say” option is available, it does not effectively allow people to express other gender identities, such as non-binary and transgender.
The changes in subjective well-being might vary in different contexts and local environment. Respondents were from 15 different cities and towns in the UK (all outside of Greater London), but this study did not incorporate spatial variables (e.g. city and town name, trip origin and destination coordinates, land use). Future work utilising spatial and context information could help shed more light on the relationship between people’s well-being changes and e-scooter use.
The survey was conducted between August and September 2021, when COVID-19 was of concern. The pandemic changed how people travel and their opinion about different modes, in the short-term but may also in the long-term. In future work, it can be beneficial to re-survey the cohort and understand how their perspectives may vary at different stages of the pandemic.
Similar to the observation in many other micro-mobility studies (Bozzi & Aguilera, 2021), the users and survey samples differ from the national census average, with more younger, male, affluent people of relatively higher educational qualifications. Different groups may have varying travel behaviours and associated subjective well-being changes. As in any survey, the findings only reflect the opinion of the respondents. The conclusions should not be over-generalised to non-scooter users or users of scooters that are not part of a shared e-scooter scheme.
The research scope didn’t encompass a policy study, given that at the time of study and paper production the schemes were still subject to formal evaluation and policy review, led by the Government. However the main implications for policy comprise two aspects. First, the work indicates that shared e-scooter schemes engender a set of well-being impacts for the users that can be considered alongside other impacts more traditionally included in scheme evaluation, positive or negative (i.e. efficiency, environmental, financial). A standard cost-benefit analysis (CBA) framework would rarely include these well-being impacts due to the challenges in monetising them. Hence an expanded joint cost-benefit and multicriteria analysis (CBA-MCA) approach would be needed with the user well-being impacts enumerated using a similar approach to that adopted here. Second, those users most likely to incur some types of well-being benefits are likely to have protected characteristics or personal challenges (for example in terms of ethnicity or personal mobility). This has implications where the development of transport policy considers equity outcomes and the distribution of impacts amongst sub-sets of the population. A further analysis could usefully consider the role of e-scooter use well-being impacts alongside the wider set of personal health benefits or costs to specific groups of individuals with protected characteristics or personal challenges – particularly if the use of e-scooters could form a ‘gateway’ mode to increased use of more active travel forms or increased outdoor activity more generally. The survey responses as a whole form part of a wider study, with further analysis, for example, on mode shift and potential environmental impacts, to be reported in future papers.
Rights to Retention
For the purposes of open access, the author has applied a creative commons license (CC BY) license to any author accepted manuscript version arising.
Data Accessibility Statements
The data can not be openly available because of ethical and legal considerations. Aggregate data will be made available in the Research Data Leeds Repository.
Additional Files
The additional files for this article can be found as follows:
Appendix 2 to 3. DOI: https://doi.org/10.16997/ats.1298.s2
Acknowledgement
The authors would like to acknowledge the contribution by Voi scooters, without whom the survey wouldn’t have been possible. The opinions expressed in the paper are those of the authors only and do not necessarily reflect the views of Voi scooters.
Funding Information
This research has been sponsored by the Alan Turing Institute under grant number R-LEE-006 and from the Medical Research Council (grant number MC_UU_00006/7). James Woodcock has received funding from the European Research Council (ERC) under the Horizon 2020 research and innovation programme (grant agreement No 817754). This material reflects only the author’s views and the Commission is not liable for any use that may be made of the information contained therein. No funds were received from commercial partners. The prize draw rewards to compensate participants for the inconvenience of participation were partly funded by The Alan Turing Institute and Voi.
Competing Interests
The authors have no competing interests to declare.
Author Contributions
Susan Grant-Muller: conceptualisation, methodology, investigation, resources, data curation, writing – original draft, writing – review & editing, Writing – review & editing, supervision, project administration, funding acquisition. Yuanxuan Yang: methodology, formal analysis, writing – original draft, writing – review & editing, software, validation, visualization. Jenna Panter: conceptualisation, methodology, writing – review and editing. James Woodcock: Conceptualisation, Methodology, Writing – editing and review.
References
1 Abreu, M. N. S., Siqueira, A. L., Cardoso, C. S., & Caiaffa, W. T. (2008). Ordinal logistic regression models: application in quality of life studies. Cadernos de Saúde Pública, 24, s581–s591. DOI: http://doi.org/10.1590/S0102-311X2008001600010
2 Almannaa, M. H., Alsahhaf, F. A., Ashqar, H. I., Elhenawy, M., Masoud, M., & Rakotonirainy, A. (2021). Perception analysis of e-scooter riders and non-riders in Riyadh, Saudi Arabia: survey outputs. Sustainability, 13 (2), 863. DOI: http://doi.org/10.3390/su13020863
3 Ball, K., Jeffery, R. W., Abbott, G., McNaughton, S. A., & Crawford, D. (2010). Is healthy behavior contagious: associations of social norms with physical activity and healthy eating. International Journal of Behavioral Nutrition and Physical Activity, 7 (1), 1–9. DOI: http://doi.org/10.1186/1479-5868-7-86
4 Ballas, D., & Tranmer, M. (2012). Happy people or happy places? A multilevel modeling approach to the analysis of happiness and well-being. International Regional Science Review, 35 (1), 70–102. DOI: http://doi.org/10.1177/0160017611403737
5 Beecham, R., & Wood, J. (2014). Exploring gendered cycling behaviours within a large-scale behavioural data-set. Transportation Planning and Technology, 37 (1), 83–97. DOI: http://doi.org/10.1080/03081060.2013.844903
6 Bieliński, T., & Ważna, A. (2020). Electric scooter sharing and bike sharing user behaviour and characteristics. Sustainability, 12 (22), 9640. DOI: http://doi.org/10.3390/su12229640
7 Bozzi, A. D., & Aguilera, A. (2021). Shared e-scooters: a review of uses, health and environmental impacts, and policy implications of a new micro-mobility service. Sustainability, 13 (16), 8676. DOI: http://doi.org/10.3390/su13168676
8 Brant, R. (1990). Assessing proportionality in the proportional odds model for ordinal logistic regression. Biometrics, 46 (4), 1171–1178. DOI: http://doi.org/10.2307/2532457
9 Branton, R., Cassese, E. C., Jones, B. S., & Westerland, C. (2011). All along the watchtower: Acculturation fear, anti-Latino affect, and immigration. The Journal of Politics, 73 (3), 664–679. DOI: http://doi.org/10.1017/S0022381611000375
10 Brown, A., Klein, N. J., & Thigpen, C. (2021). Can you park your scooter there? Why scooter riders mispark and what to do about It. Findings, 19537. DOI: http://doi.org/10.32866/001c.19537
11 Chatterjee, K., Chng, S., Clark, B., Davis, A., De Vos, J., Ettema, D., … & Reardon, L. (2020). Commuting and well-being: a critical overview of the literature with implications for policy and future research. Transport Reviews, 40 (1), 5–34. DOI: http://doi.org/10.1080/01441647.2019.1649317
12 Christoforou, Z., de Bortoli, A., Gioldasis, C., & Seidowsky, R. (2021). Who is using e-scooters and how? Evidence from Paris. Transportation research part D: transport and environment, 92, 102708. DOI: http://doi.org/10.1016/j.trd.2021.102708
13 Cottell, J., Connelly, K., & Harding, C. (2021). Micromobility in London. Centre for London. Retrieved December 14, 2022, from https://www.centreforlondon.org/wp-content/uploads/2021/09/Micromobility_in_London_Report.pdf
14 Crane, M., Rissel, C., Greaves, S., & Gebel, K. (2016). Correcting bias in self-rated quality of life: an application of anchoring vignettes and ordinal regression models to better understand QoL differences across commuting modes. Quality of life research, 25 (2), 257–266. DOI: http://doi.org/10.1007/s11136-015-1090-8
15 Cruz, N. D., Morgan, C., Morgan, R. V., Tanna, S., Talwar, C., Dattani, R., … & Gibbons, C. E. R. (2021). Injury patterns of e-scooter-related orthopaedic trauma in central London: a multicentre study. The Annals of the Royal College of Surgeons of England, 104 (3), 187–194.
16 Department for Transport. (2020) E-scooter trials: guidance for users. Retrieved December 14, 2022, from https://www.gov.uk/guidance/e-scooter-trials-guidance-for-users
17 Ettema, D., Gärling, T., Eriksson, L., Friman, M., Olsson, L. E., & Fujii, S. (2011). Satisfaction with travel and subjective well-being: Development and test of a measurement tool. Transportation Research Part F: Traffic Psychology and Behaviour, 14 (3), 167–175. DOI: http://doi.org/10.1016/j.trf.2010.11.002
18 Fitt, H., Curl, A. (2019). Perceptions and experiences of Lime scooters: Summary survey results. Retrieved December 14, 2022, from http://hdl.handle.net/10092/16336 (accessed on 28 June 2022).
19 Forgeard, M. J., Jayawickreme, E., Kern, M. L., & Seligman, M. E. (2011). Doing the right thing: measuring well-being for public policy. International Journal of Well-being, 1 (1), 79–106. DOI: http://doi.org/10.5502/ijw.v1i1.15
20 Gärling, T., Ettema, D., Connolly, F. F., Friman, M., & Olsson, L. E. (2020). Review and assessment of self-reports of travel-related emotional well-being. Journal of Transport & Health, 17, 100843. DOI: http://doi.org/10.1016/j.jth.2020.100843
21 Gioldasis, C., Christoforou, Z., & Seidowsky, R. (2021). Risk-taking behaviors of e-scooter users: a survey in Paris. Accident Analysis & Prevention, 163, 106427. DOI: http://doi.org/10.1016/j.aap.2021.106427
22 Glenn, J., Bluth, M., Christianson, M., Pressley, J., Taylor, A., Macfarlane, G. S., & Chaney, R. A. (2020). Considering the potential health impacts of electric scooters: an analysis of user reported behaviors in Provo, Utah. International journal of environmental research and public health, 17 (17), 6344. DOI: http://doi.org/10.3390/ijerph17176344
23 Harrell, F. E. (2015). Ordinal logistic regression. In Harrel, J. F. E. Harrell (ed.), Regression modeling strategies: with applications to linear models, logistic and ordinal regression, and survival analysis. Springer International Publishing, 311–325. DOI: http://doi.org/10.1007/978-3-319-19425-7_13
24 Jones, T., Harms, L., & Heinen, E. (2016). Motives, perceptions and experiences of electric bicycle owners and implications for health, wellbeing and mobility. Journal of Transport Geography, 53, 41–49. DOI: http://doi.org/10.1016/j.jtrangeo.2016.04.006
25 Kobayashi, L. M., Williams, E., Brown, C. V., Emigh, B. J., Bansal, V., Badiee, J., Checchi, K. D., Castillo, E. M. and Doucet, J. (2019). The e-merging e-pidemic of e-scooters. Trauma Surgery & Acute Care Open, 4 (1), e000337. DOI: http://doi.org/10.1136/tsaco-2019-000337
26 Kopplin, C. S., Brand, B. M., & Reichenberger, Y. (2021). Consumer acceptance of shared e-scooters for urban and short-distance mobility. Transportation Research Part D: Transport and Environment, 91, 102680. DOI: http://doi.org/10.1016/j.trd.2020.102680
27 Laa, B., & Leth, U. (2020). Survey of e-scooter users in Vienna: who they are and how they ride. Journal of Transport Geography, 89, 102874. DOI: http://doi.org/10.1016/j.jtrangeo.2020.102874
28 LaJeunesse, S., & Rodríguez, D. A. (2012). Mindfulness, time affluence, and journey-based affect: exploring relationships. Transportation Research Part F: Traffic Psychology and Behaviour, 15 (2), 196–205. DOI: http://doi.org/10.1016/j.trf.2011.12.010
29 Liu, X., & Koirala, H. (2012). Ordinal regression analysis: Using generalised ordinal logistic regression models to estimate educational data. Journal of Modern Applied Statistical Methods, 11 (1), 21. DOI: http://doi.org/10.22237/jmasm/1335846000
30 Lovelace, R., Beecham, R., Heinen, E., Tortosa, E. V., Yang, Y., Slade, C., & Roberts, A. (2020). Is the London cycle hire scheme becoming more inclusive? An evaluation of the shifting spatial distribution of uptake based on 70 million trips. Transportation Research Part A: Policy and Practice, 140, 1–15. DOI: http://doi.org/10.1016/j.tra.2020.07.017
31 Mansky, J. (2019). The motorized scooter boom that hit a century before dockless scooters. Smithsonian Magazine. Retrieved July 31, 2022, from https://www.smithsonianmag.com/history/motorized-scooter-boom-hit-century-dockless-scooters-180971989/
32 Milakis, D., Gedhardt, L., Ehebrecht, D., & Lenz, B. (2020) Is micro-mobility sustainable? An overview of implications for accessibility, air pollution, safety, physical activity and subjective well-being. In Curtis, C. (ed.), Handbook of Sustainable Transport. Edward Elgar, 180–189.
33 Mokhtarian, P. L. (2019). Subjective well-being and travel: Retrospect and prospect. Transportation, 46 (2), 493–513. DOI: http://doi.org/10.1007/s11116-018-9935-y
34 Murad, H., Fleischman, A., Sadetzki, S., Geyer, O., & Freedman, L. S. (2003). Small samples and ordered logistic regression: does it help to collapse categories of outcome? The American Statistician, 57 (3), 155–160. DOI: http://doi.org/10.1198/0003130031892
35 Nisbet, E. K., Zelenski, J. M., & Murphy, S. A. (2011). Happiness is in our nature: exploring nature relatedness as a contributor to subjective well-being. Journal of Happiness Studies, 12 (2), 303–322. DOI: http://doi.org/10.1007/s10902-010-9197-7
36 Rashed, S., Vassiliou, A., & Barber, J. (2022). Neurosurgical trauma from e-scooter usage: a review of early case series in London and a review of the literature. British Journal of Neurosurgery, 36 (4), 532–543. DOI: http://doi.org/10.1080/02688697.2021.2024506
37 Reck, D. J., & Axhausen, K. W. (2021). Who uses shared micro-mobility services? Empirical evidence from Zurich, Switzerland. Transportation Research Part D: Transport and Environment, 94, 102803. DOI: http://doi.org/10.1016/j.trd.2021.102803
38 Sanders, R. L., Branion-Calles, M. & Nelson, T. A. (2020). To scoot or not to scoot: findings from a recent survey about the benefits and barriers of using e-scooters for riders and non-riders. Transportation Research Part A: Policy and Practice, 139, 217–227. DOI: http://doi.org/10.1016/j.tra.2020.07.009
39 Sanders, R. L., da Silva Brum-Bastos, V., & Nelson, T. A. (2022). Insights from a pilot investigating the impacts of shared e-scooter use on physical activity using a single-case design methodology. Journal of Transport & Health, 25, 101379. DOI: http://doi.org/10.1016/j.jth.2022.101379
40 Sherriff, G., Blazejewski, L., Hayes, S. J., Larrington-Spencer, H. M., & Lawler, C. (2021). E-scooters in Salford: interim report. University of Salford. Retrieved December 14, 2022, from https://usir.salford.ac.uk/id/eprint/60393/
41 Sikka, N., Vila, C., Stratton, M., Ghassemi, M. and Pourmand, A., (2019). Sharing the sidewalk: a case of e-scooter related pedestrian injury. The American Journal of Emergency Medicine, 37 (9), 1807.e5–1807.e7. DOI: http://doi.org/10.1016/j.ajem.2019.06.017
42 Smith, C. S. & Schwieterman, J. P. (2018). E-scooter scenarios: evaluating the potential mobility benefits of shared dockless scooters in Chicago. The Chaddick Institute. Retrieved July 31, 2022, from https://las.depaul.edu/centers-and-institutes/chaddick-institute-for-metropolitan-development/research-and-publications/Documents/E-ScooterScenariosMicroMobilityStudy_FINAL_20181212.pdf
43 Soukiazis, E. & Ramos, S., (2016). The structure of subjective well-being and its determinants: a micro-data study for Portugal. Social Indicators Research, 126 (3), 1375–1399. DOI: http://doi.org/10.1007/s11205-015-0938-1
44 Useche, S. A., Gonzalez-Marin, A., Faus, M., & Alonso, F. (2022). Environmentally friendly, but behaviorally complex? A systematic review of e-scooter riders’ psychosocial risk features. PLoS One, 17 (5), e0268960. DOI: http://doi.org/10.1371/journal.pone.0268960
45 Woodward, A., & Wild, K. (2020). Active transportation, physical activity, and health. In Advances in Transportation and Health. Elsevier, 133–148. DOI: http://doi.org/10.1016/B978-0-12-819136-1.00005-X
46 Yang, H., Ma, Q., Wang, Z., Cai, Q., Xie, K., & Yang, D. (2020). Safety of micro-mobility: analysis of e-scooter crashes by mining news reports. Accident Analysis & Prevention, 143, 105608. DOI: http://doi.org/10.1016/j.aap.2020.105608