1 Introduction
Accessible and walkable places are characteristic of modern, sustainable cities. Walking has the potential to support low emission transport, reduce car dependency and increase social equity and inclusion. Walking is included in almost all trips as the main transport mode or as a feeder for public transport or the car (D’Orso and Migliore, 2020).
The World Health Organization (WHO) cautions against an inactive lifestyle and the resulting public health problems (WHO, 2002). Therefore, the inactive lifestyle of Western society should be counteracted by promoting physical activity as a multi-determined behaviour to minimise far-reaching health consequences in the form of an increased risk of chronic cardiovascular disease (Manson et al., 2002; Frank et al., 2006). It is assumed that environmental factors, such as neighbourhood walkability, have a considerable influence on walking and thus on the risk of developing chronic diseases (Killingsworth et al., 2003; Sallis et al., 2005; Thielman et al., 2015; Van Holle et al., 2012). So, increasing physical activity, with the focus on walking through the creation of healthy living environments, seems an important goal (WHO, 2002). In the past two decades, urban planners and transportation researchers studied the influence of the urban form on walking. Results point towards a connection between active transportation and urban form variables whereby pedestrian-friendly surroundings are associated with a decreasing risk of overweight or obesity (Glazier et al., 2012).
However, the sole explanation for walking behaviour by environmental factors seems to fall short. The decision to engage in physical activity is typically considered as a person-environment interaction (e.g., Reyer et al., 2014). Accordingly, personal factors are therefore individual prerequisites and can be defined alongside socio-demographics as internal psychological concepts, such as attitudes or perceptions. These factors result from complex or subtle relationships with physical features. There is no doubt that environmental factors influence travel behaviour, but this influence is mediated by individual perceptions of the environment (Gebel et al., 2011).
Urban planning and transportation research widely uses two concepts to investigate and analyse public space with regard to influencing factors on walking: the concepts of walking accessibility and walkability.
In the literature, walkability and walking accessibility are sometimes used synonymously (Blecic et al., 2020). However, walkability is mostly understood as an overall concept that examines a place or route, for example, a destination, an urban neighbourhood or a street segment, in terms of its pedestrian friendliness. Walkability is described using different indicators, density, design, diversity, accessibility of facilities and the like. Walking accessibility is thus seen as an important component of walkability, jointly with other components, such as safety, design, and so on (Frank et al., 2015). Walking accessibility has transport, land-use, temporal and individual components (Geurs and van Wee, 2004). It can be divided into subjective and objective measurements. It is usually measured objectively to reflect the separation of people from places (measured by distance or travel time), that is, how far people would walk to access different services. Walking accessibility is clearly destination oriented and requires a spatial relation (most often an origin and destination of a route or journey). We follow this understanding of walking accessibility, whilst discussing walkability as an overarching concept.
As one important factor for walkability, the concept of accessibilities is highly varied with important outcomes. For example, it results in positive effects on well-being (Lättman, 2018) and social inclusion (Currie and Stanley, 2008).
Regarding walking as a mode of its own, the concept of walking accessibility is often used in planning practice as a measure to ensure the provision of basic services to the population. Common instruments, such as the Walk Score®, are based on measures of travel times or distances as indicators of walking accessibility. These instruments are valuable tools for objectively determining walking accessibility. However, they do not take into account subjective perceptions of walking accessibility.
As long as individuals’ perceptions are disregarded, the potential positive outcomes of walking accessibility, such as social inclusion, cannot simply be attributed to good objective walking accessibility, since objective instruments may not capture people’s subjective realities of accessibility (Curl, 2013; Lättman et al., 2016). Recent studies analysing perceived accessibility have found that objective accessibility interrelates only weakly with perceived accessibility (Curl et al., 2015; Lättman et al., 2016). A growing body of literature highlights the need for a better understanding of the factors influencing the relationship between individuals and space regarding the quality, attractiveness and stimulation of the built environment for walking (Blecic et al., 2020). Thus, it seems important, when analysing the provision for different target groups, not only to concentrate on commonly used accessibility indicators but also to include further indicators of the walkability concept along with perceptions. As a prerequisite for social participation and promoting social inclusion, there should be a focus on walking accessibility and perceived walking accessibility, embedded in the overarching concept of walkability. By implementing these findings into a holistic instrument, it can act as a basis for planning and decision-making for practitioners and researchers of accessibility planning by identifying potentials and developing concepts for the respective areas.
In response to recent calls for more research in this area (Curl, 2013; Lättman, 2018) and especially a need for consistent methods to collect and integrate several features that affect walking into practical instruments (Clifton et al., 2007; D’Orso and Migliore, 2020), the overarching goal of this paper is to understand and depict the more comprehensive but also elusive concept of walkability by adapting an existing accessibility tool and therefore create the PEWI. We analysed accessibility from a person’s perspective and not the catchment area of an accessible facility. Therefore, we combined subjective perceptions of walking accessibility and general walkability indicators representing the physical features of the environment and the quality of the walking route in urban areas.
To achieve the overall objective, we addressed the following research questions:
How can factors representing physical features of the environment, the quality of the walking route as well as subjective perceptions of walking accessibility be integrated into an existing accessibility measurement and related discourses to develop the Perceived Environment Walking Index (PEWI)?
What are the implications for small-scale accessibility modelling?
The paper is structured as follows: Section 2 discusses existing research on walkability and accessibility and develops a conceptual model. Section 3 presents the data and applied methodology. We test the method and present the results of the PEWI in Section 4. Section 5 summarises the main findings and critically discusses further research needed in this field.
2 Previous research on walkability and accessibility methodology
2.1 The walkability debate
The overall concept of walkability has, in recent years, evolved into a multidimensional concept and describes the interaction between pedestrians, public space and its function for people to perform social practices (Blecic et al., 2020).
Blecic et al. (2020) trace ideas of walkability back to the mid-twentieth century and detects close links to debates about quality of life, social justice and the right to the city. In the last two decades, the theoretical discussion has been extended by the operationalisation of the concept of walkability (Blecic et al., 2020). Based on the need for consistent and efficient methods to collect walking environment qualities, a lot of research concentrated on operationalisation and developing decision-making tools for policymakers (Clifton et al., 2007; D’Orso and Migliore, 2020). As a concept relating to the friendliness of the environment for walking (Litman, 2003; Manzolli et al., 2021), walkability is associated with encouraging a shift from motorised transport to active mobility by creating pedestrian-friendly spaces where activities are accessible by short walking distances (Bödeker et al., 2018; D’Orso and Migliore, 2020; Papa and Bertolini, 2015; Su et al., 2017; Van Cauwenberg et al., 2016).
As one important indicator of walkability, walking accessibility is often used in urban planning and transportation research. Since Hansen introduced accessibility as the “opportunities for interaction” (Hansen, 1959, p73) focusing on the transport and land-use system, recent definitions have concentrated on the individual, for example, the ease with which people can access “[…] desired goods, services, activities and destinations” (Litman, 2003, p28). Walking accessibility measures, like the Walk Score® or Neighbourhood Destination Accessibility Index, used to determine the shortest distance (or effort, cost, travel time) to a facility, are mostly based on the shortest-path algorithm on a graph. The Walk Score® was originally developed to promote the real estate market in the USA. It targets homebuyers in more middle-class neighbourhoods. In its original form, the Walk Score® takes only limited account of urban planning and policy aspects. More detailed explanations of Walk Score® methodology follow in section 3.1.
Accessibility measures are typically static, seem to imply homogeneous accessibility among people living in one place and say nothing about how that accessibility is experienced by people living in places defined as (in-)accessible. The term ‘perceived accessibility’ is intended to counter this criticism and to include the perceptions of individuals into accessibility measurement. Perceived accessibility describes “how easy it is to live a satisfactory life using the transport system” (Lättman et al., 2016, p257). Pot et al. (2021, p1) define it in a recent study as “the perceived potential to participate in spatially dispersed opportunities”. Recent studies empirically capture perceptions of accessibility surveys with the intention of integrating perceptions into accessibility analyses. This has resulted in a number of measurement methods, like measuring the overall perceptions of accessibility (Curl, 2013), the Perceived Accessibility Scale (Lättman et al., 2016) and measuring perceived walking accessibility (van der Vlugt et al., 2019). Van der Vlugt et al. (2022) found that perceived walking accessibility has a significant direct positive impact on walking, even after accounting for objectively measured accessibility. This is backed up by the recent work of Ma and Cao (2019), Tuckel and Milczarski (2015), Lättman (2018) and Gebel et al. (2011). These findings have not yet been integrated into spatially measured accessibility.
2.2 Walkability research perspectives
In their recent work, Blecic et al. (2020) identified three strands of walkability studies. The first examines the relationship between the built environment and walking. The second concentrates on individuality and the perception of pedestrians. The third strand explores walkability from a human capabilities’ perspective. In the following, the focus is on the first two strands, but the third strand is also briefly outlined due to its importance.
2.2.1 The built environment and walking
A number of studies have explored the relationship between the built environment and walking. With the intention of understanding influencing factors of the built environment on walking, Kelly et al. (2011) point out that the quality and quantity of walking are related to urban design features, like road crossings, the land-use mix and compactness of neighbourhoods. Neighbourhoods combining these characteristics are more motivating for walking than car-oriented neighbourhoods (see also Leyden, 2003). Moudon et al. (2006) also identified a positive association between features of the built environment, like higher residential density, smaller street blocks and short walking distances to daily facilities.
Several studies developed walkability measures by identifying features of the built environment affecting walking. Glazier et al. (2012) elaborate on the four indicators that seem most significant: dwelling density (Berke et al., 2007; Frank et al., 2005; Li et al., 2005; Moudon et al., 2006), street connectivity (Frank et al., 2005; Li et al., 2005), proximity to walkable destinations (Berke et al., 2007; Moudon et al., 2006) and land-use mix (Frank et al., 2005; 2007; 2009). These studies have in common that land-use mix and density, whether in the form of population density, density of facilities (walking accessibility) or intersection density, are probably the most important influencing factors when it comes to increasing walking.
A range of previous studies investigate the effect of walkability from a physical and mental health perspective, directly related to this line of research. Saelens et al. (2003), for example, evaluated the walkability, physical activity and weight status on a micro level neighbourhood scale. By using self-reported measures, they found that people living in highly walkable neighbourhoods walk more and had lower obesity prevalence than people in less walkable, sprawling neighbourhoods. Walkability was described by high residential density, land-use mix, street connectivity, aesthetics and safety (Glazier et al., 2012; Saelens et al., 2003). Zuniga-Teran et al. (2017) underpin the influence of neighbourhood design types on human well-being and analysed four types of neighbourhood designs, their walkability and effect on physical activity and well-being.
2.2.2 Individuality and perception of pedestrians
The second research strand of walkability studies examines the individuality of human beings and their different experiences of walking. Attention was paid to the importance of both subjective and objective features of the environment (van Acker et al., 2011). The rationale is that there is no direct effect of the built environment on behaviour, but rather people individually process what they perceive and do so in different ways. Several studies focus on different target groups related to age, gender, disability or ethnicity. For example, Cao et al. (2009) found that there are significant effects of built environment features on physical activity which become insignificant when controlling for socio-demographics. Focusing on people’s perceptions De Vos et al. (2023) conducted recently a comprehensive literature review on perceived walkability, highlighting the importance of this research strand. Therein, recent studies have found that, similar to perceived walking accessibility, overall perceived walkability has an important influence on walking (Consoli et al., 2020; Suarez-Balcazar et al., 2020; Solbraa et al., 2018; van Dyck et al., 2013; Zeng and Shen, 2020).
These studies focus on different walkability indicators and their perception by different target groups. Some studies, like Bartshe et al. (2018), found no impact from walkability perceptions on physical activity among students in Las Vegas. Perez et al. (2011) also indicated no effect of perceived walkability on walking by investigating ethnic minority women in Canada. However, the majority of studies show a significant effect. Solbraa et al. (2018) indicated that the perceptions of feasible travel time to different amenities promote physical activity for 900 Norwegian adults. In a Belgian case study, van Dyck et al. (2013) analysed the perceptions of land-use mix, safety, density as well as walkability and found that these elements have a positive impact on the duration and frequency of walking. Zeng and Shen (2020) focus on different facets of a neighbourhood and its perception and find a positive effect especially amongst older people and middle aged on recreational trips in China. By analysing the factors influencing walkability perceptions, Root et al. (2017) found a correlation between the assessment of aesthetics and perceived walkability. Lui and Wong (2021) indicated that walkability perception influences walking speed and balance among older people with no effect on walking time.
2.2.3 Human capabilities
In the third strand of research, studies examine walkability in relation to human capabilities. The underlying capability approach (Sen, 1999) focuses on individual capabilities “to choose a life one has reason to value” (Sen, 1999, p74). The capability concept highlights two components: (1) ability and (2) opportunity. Ability refers to a person’s characteristics (his/her “internal power”), while opportunity refers to external conditions, such as the social and environmental context that enable the exercise of the person’s internal power (Fancello et al., 2020). Therefore, the intention of the approach is “[…] to enhance the freedom people have to choose their beings and doings through the conversion of conditions and commodities in advantage for their development” (Fancello et al., 2020, p3). Recent studies highlight the importance of walkability as a determinant of urban capabilities (Blecic et al., 2015; Reyer, 2017), quality of life and as a factor that can make a significant contribution to the development of the social capital of cities (Blecic et al., 2020). This implies that an individual’s relationship with walking and his/her local area extends beyond that covered by our study.
2.3 Walkability measurement
In most studies, built environment features dominate when measuring walkability. However, in the last two decades, attempts have been made to combine several strands of walkability studies. In order to represent the influence of the environment on travel, Cervero and Kockelman (1997) identified the 3Ds: diversity, density and design. By developing a pedestrian strategy for London, Gardner et al. (1996) developed the 5Cs, which identified five qualities of the walking environment with the categories ‘connected’, ‘convenient’, ‘comfortable’, ‘convivial’ and ‘conspicuous’. This was followed by studies that included objective and subjective qualities in walkability. For example, Sarkar (1993) evaluated six criteria of a walking environment: safety, security, comfort and convenience, continuity, system coherence and attractiveness. Pikora et al. (2002), on the other hand, identified four categories that have an influence on walking: functionality, aesthetics, destinations and safety. Ewing (1999) also formulated ten influential factors for a walking friendly environment (medium-to-high densities, mix of land use, short-to-medium length blocks, transit routes every half-mile, two-to-four lane streets, continuous pavements wide enough for couples, safe crossings, appropriate buffering from traffic, street-oriented buildings and comfortable and safe places to wait). Ewing and Cervero (2010) expanded the 3D into 5D: diversity, density and design, destination to facilities and destination to transit. Galanis and Eliou (2011) identified five basic factors for a walkable urban environment: road safety, attractiveness, personal safety, accessibility and convenience broken down into road segment indicators, including the features of the street (pavement width, street furniture), corner indicators describing features of pavement corners (ramps) and crossing indicators (length, width). Furthermore, D’Alessandro et al. (2016) identified twelve indicators and split them into three categories: namely, safety (crossing protection, protection from vehicles, road lighting), pleasantness (vehicular traffic, building context and green spaces) and practicability (obstacles, pavement surface, road slope). Blecic et al. (2020) identify four walkability indicator categories based on their literature review: efficiency and comfort, safety, security and certainty as well as pleasantness and attractiveness.
Recent walkability perception studies already described in 2.2.2 like van Dyck et al. (2013) and Suarez-Balcazar et al. (2020), used the Neighbourhood Environment Walkability Scale (NEWS), developed by Saelens et al. (2003). The NEWS contains 83 items, including walking time to 23 different facilities and also 17 satisfaction-related items. These items cover residential density, land-use mix access, land-use mix diversity, satisfaction, walking and cycling facilities, aesthetics, traffic safety and crime safety. Due to the immense length, shortened and target-group specific NEWS versions were developed. The Neighbourhood Environment Walkability Scale (abbreviated as NEWS-A) no longer includes walking time and excludes residential related questions. It now consists of only 37 items, used in many studies (Bartshe et al., 2018; Berry et al., 2017; Brown and Jensen, 2020; Consoli et al., 2020; Jensen et al., 2017; Lui and Wong, 2021; Perez et al., 2011). The NEWS-Y (for young people) is also based on the NEWS-A and was used, for example, by Hinckson et al. (2017) to investigate the perceived walkability of adolescents. Alongside NEWS, the Physical Activity Neighbourhood Environment Scale (PANES) measures perceived density, walking infrastructure, traffic safety and accessibility to amenities based on 17 statements (Sallis et al., 2010). Furthermore, the Leyden Walkability Instrument (LWI) measures perceived walkability on a scale basis (Bias et al., 2010; Leyden, 2003).
These studies often use multi-method study design to operationalise and collect data for these categories. In addition to objective characteristic data and open data, Google Street View data, expert inventory surveys, general surveys and in-depth interviews are used to collect data.
2.4 Research gap
The literature review has shown that walking accessibility as a dimension of walkability is not sufficient to analyse the local provision of facilities and services for different target groups. Therefore, walking accessibility perception as well as the physical features and qualities of the walking route seem particularly relevant for walking and can determine whether a route is taken on foot or by another transport mode. It seems essential to adapt an existing accessibility analysis instrument with walkability indicators and perceptions in order to provide a more nuanced picture of the local provision of facilities and services for different population groups. Various studies responded to the critique of one-dimensional walkability assessments by measuring distances and the facilities to be reached (Blecic et al., 2020) and made efforts to combine different strands of walkability, such as the CANVAS (Bader et al., 2015), the IAAPE Measure of Walkability (Moura et al., 2017), the OS-WALK-EU tool (Fina et al., 2022) and the Walkability Explorer (Blecic et al., 2015). Although a large number of tools is available, there is still a lack of studies on a holistic view of walkability with regard to: firstly, target group-specific adaptation in terms of weighting and number of facilities to be considered; secondly, simultaneously considering multiple indicators of the physical characteristics of an environment and the quality of a walking route; and, thirdly, the integration of perceptions into existing tools. Most studies have compared different methods but show deficits in terms of spatial modelling and integration of all elements into one instrument or tool.
2.5 Conceptual framework
Based on the literature review and the research gap identified, we developed a conceptual framework that provides the basis for developing an adapted instrument, the Perceived Environment Walking Index (PEWI) (Figure 1, to be read from top to bottom). Adaption takes place in three steps. First, since we paradigmatically place our approach in strands one and two of walkability research (Section 2.2), we calculated the Walk Score® that represents objective walking accessibility (strand one) and adapted it to the specific target groups (strand two). To do so, we adjusted the weighting and variety of facilities included in the accessibility calculation (step 1). Second, we integrated 18 indicators which give a more nuanced description of the influence of the built environment on the walkability of different target groups, representing physical features (step 2a) and the quality of the walking route (strands one and two) (step 2b) broken down into the categories of efficiency and comfort, safety, security and certainty as well as pleasantness and attractiveness according to Blecic et al. (2020). We renamed the category ‘efficiency and comfort’ as ‘functionality’ as well as the category ‘safety, security and certainty’ as ‘safety and security’ because we feel this fits the characteristics of its variables better. The third and final basis was on our preliminary work on factors influencing walking accessibility perception and their effect on walking (step 3).
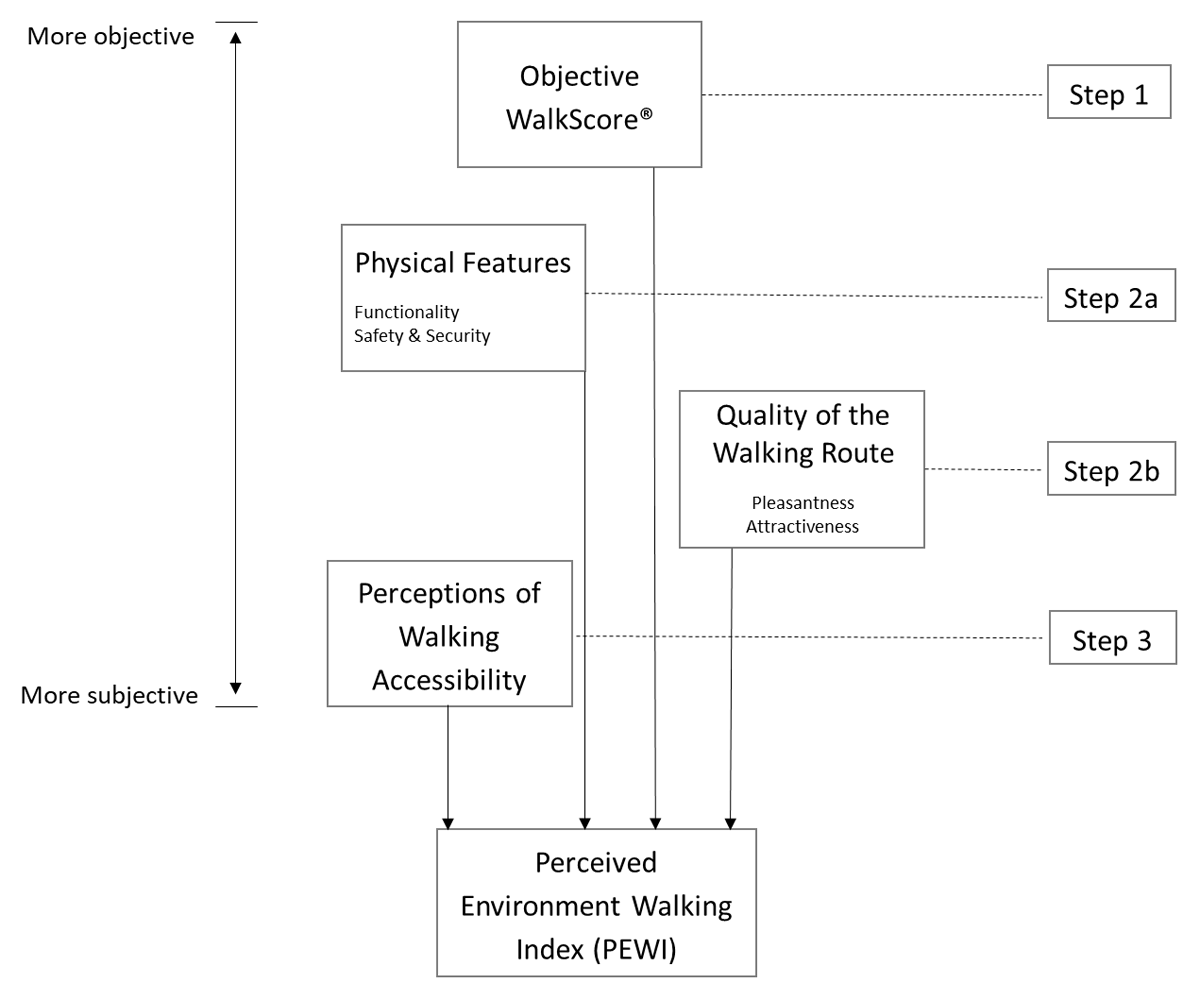
Conceptual framework.
3 Methods
A multi-method study design was developed based on the indicators for accessibility and walkability discussed above.
The investigation areas were two urban neighbourhoods in Bahrenfeld and Barmbek-Nord in Hamburg, Germany. Whenever the terms Bahrenfeld or Barmbek-Nord are used in the following, this always refers to the study areas as part of these neighbourhoods. They are characterised by similar distances to Hamburg city centre and show a similar social structure, but the local provision of facilities and services of Barmbek-Nord are located along a main traffic axis and Bahrenfeld is characterised by a dispersed local provision of facilities and services.
We selected two distinct target groups defined by age/life stage and jointly analysed these in this paper. Our first target group comprised people aged 65 and older. In terms of walkability, with increasing age older people have a smaller activity range, decreasing travel participation and less frequent journeys. Access to the local provision of facilities and services and social infrastructure are basic requirements for an independent life. Combined with communication and interaction opportunities, these are the key to counteracting the risk of social exclusion. Walkability therefore plays a particularly important role (Amaya et al., 2022; Bereitschaft, 2021; Kerr et al., 2012). Our second target group were families with at least one child aged 15 or younger. Regarding walkability, young families are also particularly interesting to investigate. As similarly discussed in van der Vlugt et al. (2022) the link between the living environment and everyday travel behaviour seems to be gradually loosening, as car ownership of young adults increases as they enter parenthood (Oakil et al., 2016; Scheiner, 2013). On the other hand, families with young children are becoming increasingly aware of the qualities of urban neighbourhoods with their potential for climate-friendly and health-promoting travel as well as their cultural and social infrastructure (Haase et al., 2006; Kabisch et al., 2012).
Both groups are characterised by a very high share of walking trips compared to other target groups (BMVI, 2018). In addition, both groups have similar needs regarding their requirements for the built environment (Warner and Zhang, 2019). While their needs are different in terms of destinations (e.g., schools vs. general practitioners), basic walkability requirements are similar due to physical limitations in older age on the one hand and walking with children with walking aids on the other hand (rollators, canes, prams, or baby bicycles). For example, both groups need a barrier-free environment, kerbstone lowering and are similarly influenced by obstruction due to parking and narrow pavements. We therefore jointly analysed both groups, which also helps contend with a limited sample size.
3.1 Walk Score®: An objective instrument for assessing walking accessibility
As a first step, objective accessibility was calculated according to the well-known Walk Score® (Carr et al., 2010; Duncan et al., 2011; Walk Score®, 2011). The Walk Score® is an efficient, cost-effective valid measurement to assess walking accessibility (Carr et al., 2010, 2011; Duncan et al., 2016). Since it is a common and widely accepted methodology approach which has been used and adapted in several academic papers (Vale et al., 2016; Hall and Ram, 2018; Fina et al., 2022), we decided to use the Walk Score® as the basis of our analysis. The analysis required different basic datasets: geometries (as a starting point for distance calculation), facilities (as an end point for distance calculation) and the road network (to calculate the shortest distances). For our analysis, we decided to choose a 100x100 metre grid, allowing the calculation of very detailed objective walking accessibility measures and making the units independent of administrative boundaries (Göddecke-Stellmann, 2013; Kaup and Rieffel, 2013; Neutze, 2015).
A comprehensive and thematically diverse database was set up for facilities. In the process, locations with particularly important facilities for the local provision of facilities and services of the population in Bahrenfeld and Barmbek-Nord were identified via open geodata from the city of Hamburg, enquiries, internet research via maps, OpenStreetMap (OSM) and the Yellow Pages. These locations were geocoded in the reference system in order to use them in GIS as destinations in an accessibility analysis (van der Vlugt and Welsch, 2020).
In this first step, we base the calculation of objective walking accessibility principally on the Walk Score® methodology but adapt it in certain aspects. This includes the decay function and the integration/selection of facilities. Table 1 shows the facilities included. The first nine indicators, based on the original Walk Score® (light grey), were supplemented by two additional indicators (pharmacies, general practitioners) (dark grey). These were selected since recent studies underline the importance of healthcare as an essential component of public services and they are important destinations, especially for the two target groups (Ahlmeyer and Wittowsky, 2018; Chudyk et al., 2015). The facilities were included in the calculation with varying frequency and weighting. The distance to the nearest destination of various facilities was calculated on this basis. The absolute distances were converted into a distance function value. The distance decay function determined what percentage of a full score a category received based on the distance of the calculated walking route, that is, between origin and destination. We used a cumulative Gaussian distance decay function (Vale and Pereira, 2017). A distance within 300m to the facility got the full score. After this, scores decreased gently with distance. At a distance of 1.5km, facilities received only about 25% of the score. After 1.5km, the scores decreased less quickly with greater distance until they reached 2.5km, after which they did not enter the final score (Walk Score®, 2011). The distance decay function converted the distances into point values based on the distances and weightings of the facilities. The maximum value is 25. According to the Walk Score® calculation logic, a linear expansion is made on a scale from 0 to 100 (Walk Score®, 2011). For this purpose, the values are multiplied by a factor of 4.
Facilities included in the PEWI.
| Walkscore | ||
| Indicator | Weighting | Variety |
| Grocery shops | 3 | [3] |
| Restaurants | 3 | [0.75;0.45;0.25;0.25;0.225;0.225;0.225;0.225;0.2;0.2] |
| Shopping | 2 | [0.5;0.45;0.4;0.35;0.3] |
| Cafés/ Bakeries | 2 | [1.25;0.75] |
| ATMs | 1 | [1] |
| Parks/Green spaces | 1 | [1] |
| Bookshops/Libraries | 1 | [1] |
| Leisure/Entertainment | 1 | [1] |
| Schools | 1 | [1] |
| Pharmacies | 1 | [1] |
| General practitioners | 2 | [1.25;0.75] |
Light grey: facilities based on the original Walk Score®; dark grey: facilities supplemented by the authors.
3.2 Systematic neighbourhood audit to collect walkability indicators
As a second step, a small-scale neighbourhood audit was conducted to collect walkability indicators representing the qualities of the living environment and of urban walking routes. By using the methodology of a neighbourhood audit on a small-scale level, we are able to collect detailed information about specific neighbourhood characteristics that cannot be obtained from secondary data (for example, the number of trees, pavement width, obstruction due to parking). Besides the availability of data, some indicators need to be directly observed or felt. Therefore, the neighbourhood audit is a suitable method to record specific walkability indicators, which include impressions as well as just the recorded data. Using an assessment form, walkability indicators per street segment were assessed by a trained team in both study areas. In one week, a total of 95 street segments in Bahrenfeld and 85 street segments in Barmbek-Nord were examined with regard to walkability indicators. The segments were assessed by two people to limit survey bias and ensure a certain objectivity (Figures 2 and 3). As already explained in the conceptual framework, four broad categories of walkability indicators were analysed following Blecic et al. (2020), complemented by the perception criteria. Based on the literature review the overarching criteria were further subdivided into thematic segments (pavement, street design, barrier-free environment, green space, noise, attractiveness of the environment, subjective fear-causing points, perceived walking accessibility) and broken down into a total of 18 walkability indicators (Table 2).
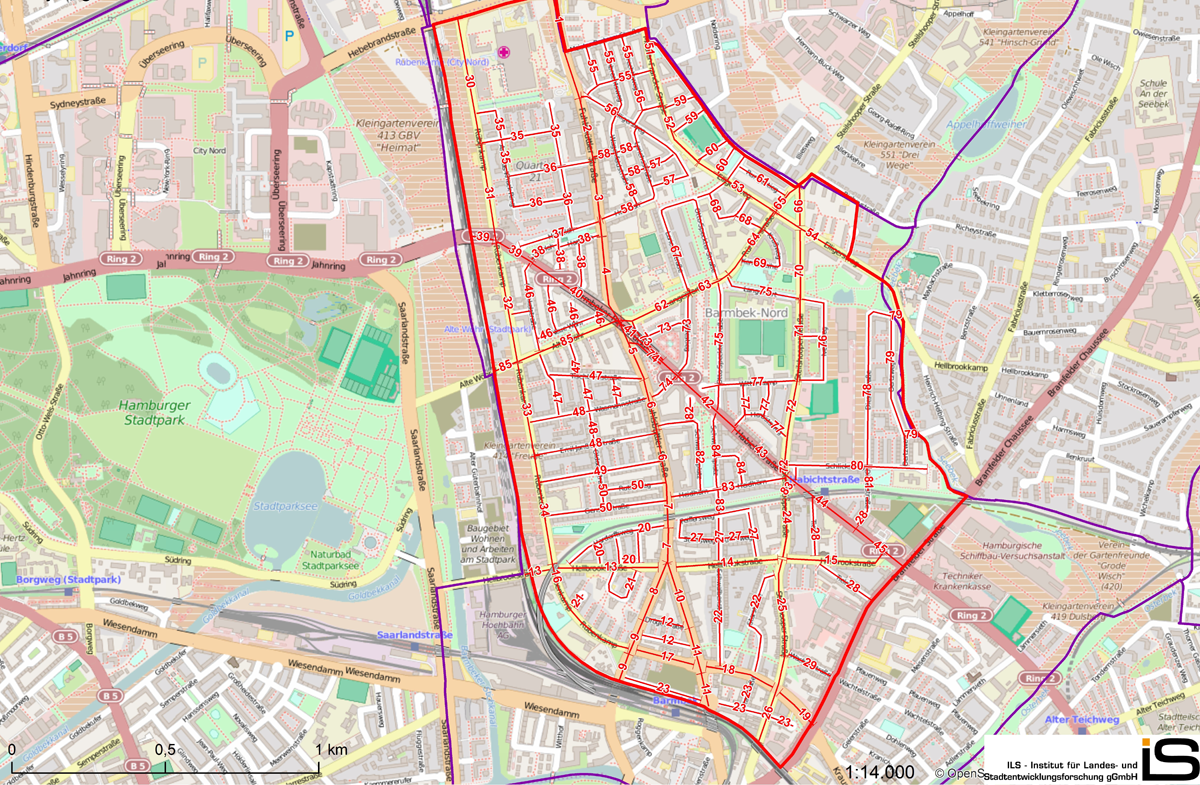
Investigation area in Hamburg Barmbek-Nord. Source: OpenStreetMap
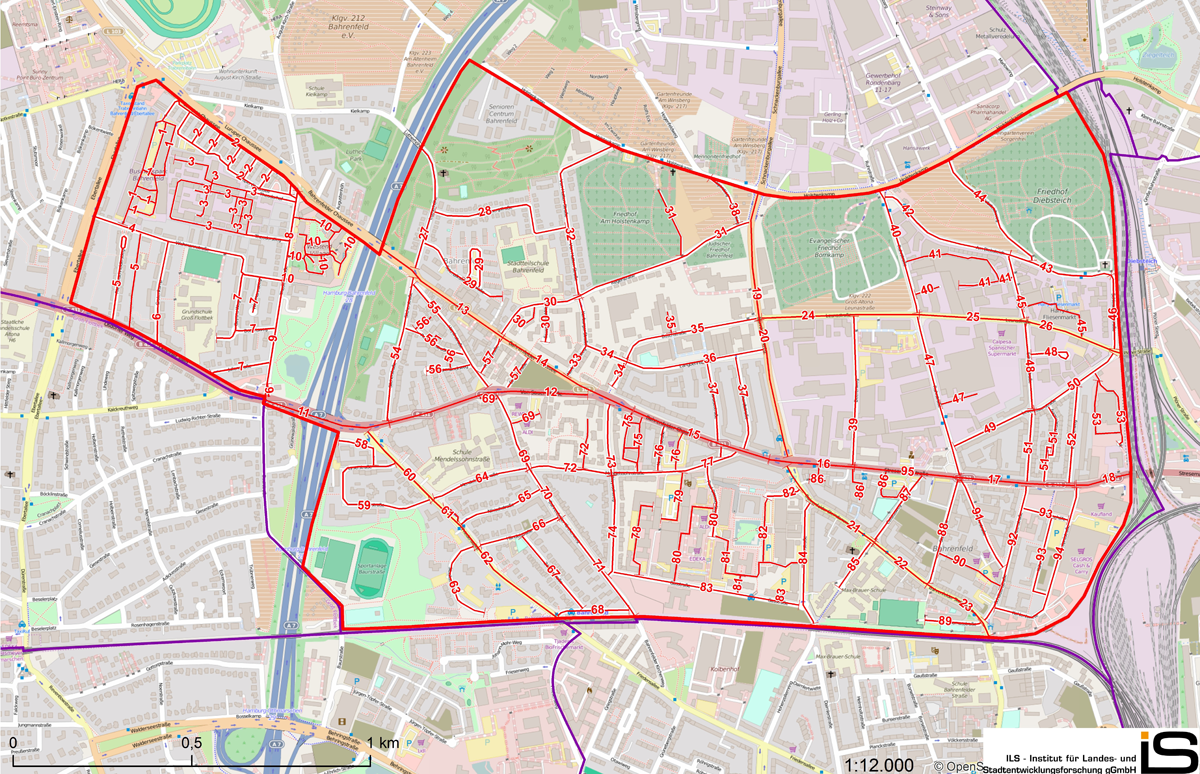
Investigation area in Hamburg Bahrenfeld. Source: OpenStreetMap
Walkability indicators and walking accessibility perceptions for integration in the instrument.
| Criteria | Subsegement | Indicator | Description | Reference (Selection) | Evaluation creatia | Weighting factor (deduction in %) | Application rules of the deduction (majority / single segment) |
| Functionality | Pavement | Pavement width | Effective walkway width for comfortable walking for one or more persons | Alfonzo, 2005; Kelly et al., 2011; Manzolli et al., 2021; Wennberg et al., 2018; Ruiz- Padillo et al., 2018 | 1 person | –2 | majority of the segments |
| 2 persons | 0 | ||||||
| 3 persons | 0 | ||||||
| Obstacles on the pavement | The presence of potential obstacles or barriers such as banners and tree roots | Handy and Clifton, 2001; Alfonzo, 2005 | yes | –2 | single segment | ||
| no | 0 | ||||||
| Barrier-free environment | Steps | Presence of steps which have an impact on walkability for different groups | van der Vlugt and Welsch, 2020; Wennberg et al., 2018 | yes | –2 | single segment | |
| no | 0 | ||||||
| Kerbstone lowering | Presence of kerbstone lowering as one essential element for the street crossing | Wennberg et al., 2018 | yes | 0 | single segment | ||
| no | –2 | ||||||
| Seating possibilities | Presence of seating possibility that enhances the quality of walking in public spaces | Bradshaw, 1993; Wennberg et al., 2018; D’Orso and Migliore, 2020 | yes | 0 | single segment | ||
| no | –2 | ||||||
| Safety & Security | Street design | Car/Traffic Speed | Sense of security related to the allowed speed level | Otsuka et al., 2021; Kelly et al., 2011; D’Orso and Migliore, 2020 | traffic–calmed area | 0 | majority of the segments |
| 30 km/h speed limit | 0 | ||||||
| 50 km/h speed limit | –2 | ||||||
| Traffic Lanes | Sense of security related to number of lanes | Bradshaw, 1993; Wennberg et al., 2018; D’Orso and Migliore, 2020 | single–track | 0 | majority of the segments | ||
| two lanes | –2 | ||||||
| Separation due to road width | Separation effects due to the road width | Alfonzo, 2005 | yes | –2 | majority of the segments | ||
| no | 0 | ||||||
| Street crossing options | Ease and opportunities to cross the street | Wennberg et al., 2018; Manzolli et al., 2021 | yes | 0 | majority of the segments | ||
| no | –2 | ||||||
| Obstruction through parked cars | Presence of parked cars which obstruct the pavement and hinder the crossings | Alfonzo, 2005 | yes | –2 | single segment | ||
| no | 0 | ||||||
| Pleasantness | Green space | Trees | Presence of trees | Ewing and Handy, 2009; Manzolli et al., 2021; Alfonzo, 2005 | yes | 0 | majority of the segments |
| no | –2 | ||||||
| Street greenery | Presence of street greenery like flower beds or green areas | Adkins et al., 2012; D’Orso and Migliore, 2020 | yes | 0 | majority of the segments | ||
| no | –2 | ||||||
| Noise | Noise pollution | Presence of different noise level while walking | Otsuka et al., 2021; Ewing and Handy, 2009 | below 55 dB | 0 | majority of the segments | |
| between 55 and 65 dB | –2 | ||||||
| between 65 and 75dB | –4 | ||||||
| above 75dB | –6 | ||||||
| Attractiveness | Attractiveness of the environment | Attractiveness of the sidewalk | Assessment of subjective aesthetic, beauty and charm of the pavement, to enjoy walking | Adkins et al., 2012; Ruiz-Padillo et al., 2018 | very attractive | 0 | majority of the segments |
| attractive | 0 | ||||||
| not very attractive / unattractive | –2 | ||||||
| Attractiveness of the roadspace | Assessment of subjective aesthetic, beauty and charm of the roadspace, to enjoy walking | Adkins et al., 2012; Ruiz-Padillo et al., 2018 | very attractive | 0 | majority of the segments | ||
| attractive | 0 | ||||||
| not very attractive / unattractive | –2 | ||||||
| Potential spaces of fear | Badly illuminated spots | Presence of poorly illuminated spots, i.e., poor lighting or lack of streetlights | Wennberg et al., 2018; Kelly et al., 2011; D’orso and Migliore, 2020 | yes | –2 | single segment | |
| no | 0 | ||||||
| Spaces of fear | Presence of potential space of fear which is related to the protection from various risks during the walking experience like pedestrian subway and the perception of security against crime | Garcia-Carpintero et al., 2022; van der Vlugt et al., 2019; D’Orso and Migliore, 2020 | yes | –2 | single segment | ||
| no | 0 | ||||||
| Liveliness | Encounters with people | Presence of people impacting positively liveability and walkability | Southworth, 2005; Alfonzo, 2005 | Yes | 0 | single segment | |
| no | –2 | ||||||
| Perceived walking accessibility | Factor perceived walking accessibility | Subjective assessment of the walking accessibility (household survey) | van der Vlugt et al., 2019; 2022 | 1 | –8 | majority of the segments | |
| 2 | –6 | ||||||
| 3 | –4 | ||||||
| 4 | –2 | ||||||
| 5 | 0 |
Table 2 illustrates the analysed walkability indicators, their measurement and weighting factor for adapting the Walk Score®. We decided to apply an additive equal weighting of the walkability indicators in the form of deduction points. Deduction points count any aspects on the route that negatively affect walkability. Equal weighting means that we do not weight one indicator higher than another. For example, the presence of trees is not weighted higher than the presence of seating or obstruction due to parking. We have deliberately chosen a deficit analysis with the aim to reveal the potential for intervention of the individual indicators and to critically examine whether a pedestrian paradise really exists. This means that any variable affecting walkability will result in a 2 percent deduction (such as an obstacle on the pavement or a 50 km/h speed limit). This applies to all variables except noise pollution and perceived walking accessibility. This is justified by the fact that average exposure to noise above 55 dB seriously harms health (WHO, 2010) and can trigger high blood pressure and heart diseases (European Commission). It is not sufficient to integrate just one level of noise pollution, since an increase in decibel levels has exponential negative effects on human health (European Environment Agency, 2020) resulting in cardiovascular and psychophysiological effects (WHO, 2010). We therefore differentiated between four decibel levels starting in line with Otsuka et al. (2021) with penalties above 55 dB having a 2% deduction. In the case of perceived walking accessibility (the only variable reflecting the individual perception of the target groups), it is not useful to include just one characteristic either. By classifying the variable into five categories, we tried to include heterogeneous human perceptions.
Accordingly, the deduction points were summed up per street segment in an additive equal weighting and integrated into the PEWI calculation.
3.3 Household survey to collect perceptions of accessibility
As a third step we developed a household survey in the two investigation areas in 2015 to collect and integrate subjective perceptions. A random sample of 400 households of the relevant target groups, 200 per neighbourhood was randomly selected based on a stratified sample of the two target groups retrieved from the resident’s registration office. The survey documents were placed in the letterboxes of the selected households together with a stamped return envelope. All adults in the household were encouraged to complete the survey about their perceptions of accessibility, mobility requirements, usual transport modes, time-dependent safety perceptions, barrier-free environment as well as their travel and neighbourhood related attitudes. We incorporated data previously presented in van der Vlugt et al. (2019; 2022).
The participants were on average 60.51 (sd 19.12) years old with a slight predominance of women among the respondents (59.9%) in Bahrenfeld (60.3%) as well as in Barmbek-Nord (59.5%). More than half of the respondents did not have a university degree (59.3%) and had an average monthly household net income of less than 3,000 € (55.6%).
As the main indicator to capture individual perceptions, perceived walking accessibility was calculated using a factor analysis and subsequent averaging of three items measured on a five-point Likert scale:
I can access anything in my living environment (x̄ = 3.46, sd = 1.18)
In my living environment, I can do all my everyday walks easily on foot (x̄ = 3.56, sd = 1.26)
I am satisfied with the pedestrian accessibility of services (x̄ = 3.76, sd = 0.72)
Based on a high-level correlation between these items (α = 0.739), the factor of perceived walking accessibility was created as an average scale. For more details, we refer interested readers to van der Vlugt et al. (2019).
The perceptions of accessibility differ by neighbourhood and age group. Both older people and young families perceive accessibility better in Barmek-Nord (3.93; sd 0.75) than in Bahrenfeld (3.27; sd 0.87). Since we do not distinguish between the target groups in this paper, we rather focus on the difference between the two target areas.
The perceived walking accessibility scale has a value range of 1–5 and is integrated in the PEWI in 2 percentage steps (see weighting factor in Table 2). Since the survey is based on a random sample, some grid cells include several respondents while others have zero observations. Therefore, the values were interpolated over the entire study area and averaged to the grid cells.
The household survey method was chosen in order to be able to quantitatively survey perceptions of accessibility. Through the preliminary work of van der Vlugt et al. (2019), it was possible to integrate the factor of perceived accessibility into an instrument, which would not have been possible with qualitative data.
3.4 Developing the Perceived Environment Walking Index (PEWI)
The PEWI was calculated based on the description in Section 3.1. In this process, the road segments investigated from the walkability audit were intersected with the population grid (100m × 100m). As a result, 233 inhabited grid cells each in Bahrenfeld and Barmbek-Nord were included in the calculation. A network analysis was used to re-calculate the shortest route to the different facilities, taking into account the above-described indicators. Each route was loaded with deduction points, depending on the respective walkability indicator assessment as well as the perceived walking accessibility score (Table 2).
As a special characteristic of the neighbourhood audit, each route consisted of different segments and regularities determined the conditions under which deduction points were assigned per route: A distinction was made between indicators for which deduction points were assigned for the entire route as soon as they occurred in a single segment (e.g., steps, obstacles, available seating) and indicators that must be present in the majority of the segments for deduction points (count or length) to be assigned for the entire route (separation due to road width, trees, lanes, street greenery) (Table 2, right column).
The loaded routes were then included in the PEWI according to the variety and weighting of each facility.
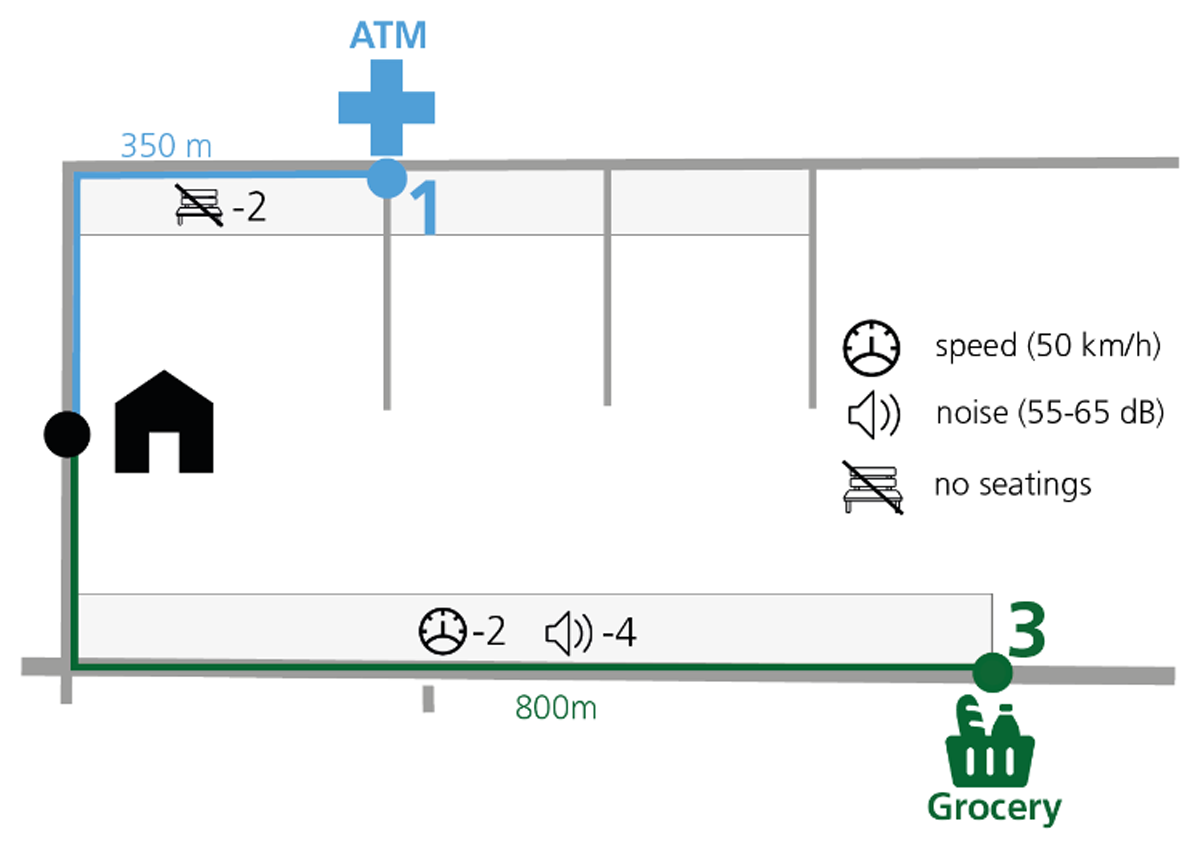
To visualise this approach, Figure 4 shows a simplified illustration of this calculation. It shows the deductions on the Walkscore based on two trips (ATM and the grocery store) and three walkability indicators (speed, noise pollution, and available seating).
Simplified example of the calculation of the PEWI.
The first route (green) leads to a grocery store with an infrastructure weighting of 3: a large part of this route goes along a main road with a maximum speed of 50 km/h and a noise level of 65 to 75dB, which leads to a deduction of 6%. Equation (1) shows the entire calculation. The plain value after the distance weighting is 2.07; by deducting noise and speed the value is only 1.97.
(1)
The second trip (blue) to the ATM is only 350m but is not equipped with benches. Without the deductions the plain value is 0.99 (see equation 2). The 2% deductions reduce the value to 0.98.
(2)
4 Results
This section presents and discusses our results. First, we introduce the PEWI in four steps. Referring to Table 2, we present the four indicator families Functionality, Safety and Security, Pleasantness as well as Attractiveness and their influence on walkability step by step for the two study areas. Second, we present the PEWI as a conclusive result and take a detailed look at the differences between objective walking accessibility and the Perceived Environment Walking Index.
4.1 Introducing the PEWI: The integration of physical features and qualities of the walking routes and their influence on walkability
4.1.1 Introducing the PEWI – Functionality
We integrated all the walkability indicators by adapting the objective walking accessibility (Walkscore). To be able to evaluate the effects of the various indicators on walkability (PEWI), Figures 5b, 6b, 7b and 8b show the average point deduction per indicator. In the functionality category, which refers especially to barrier-free environment that has great importance for both target groups, deductions of up to –10% per route are possible. Barmbek-Nord (B-N) performs better than Bahrenfeld (B) for almost all indicators. This means that the study area is better equipped with available seating, which is especially important for the target groups, (average point deduction: B-N: –0.45; B: –0.7), there are fewer obstacles on the pavement and the pavement width also shows a smaller deficit than in Bahrenfeld. Only in kerbstone lowering as an important indicator of barrier-free environment does Bahrenfeld score slightly better than Barmbek-Nord (B: –0.82; B-N: –0.96). Steps hardly seem to be a problem in both study areas.
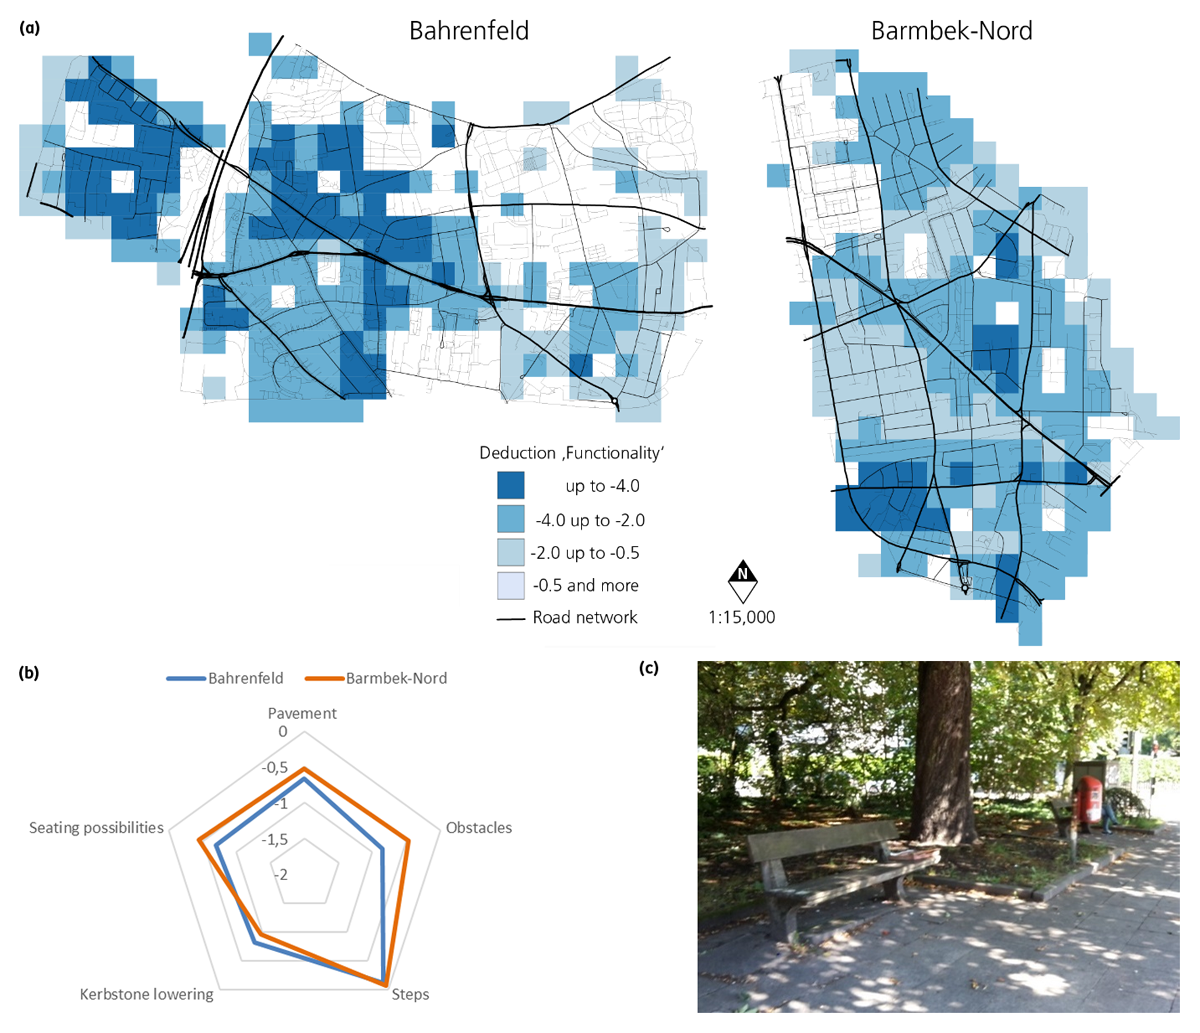
(a) Average deduction Functionality (in points) in Bahrenfeld and Barmbek-Nord. (b) Average deduction Functionality (in points). (c) Available seating in Bahrenfeld. Source: van der Vlugt.
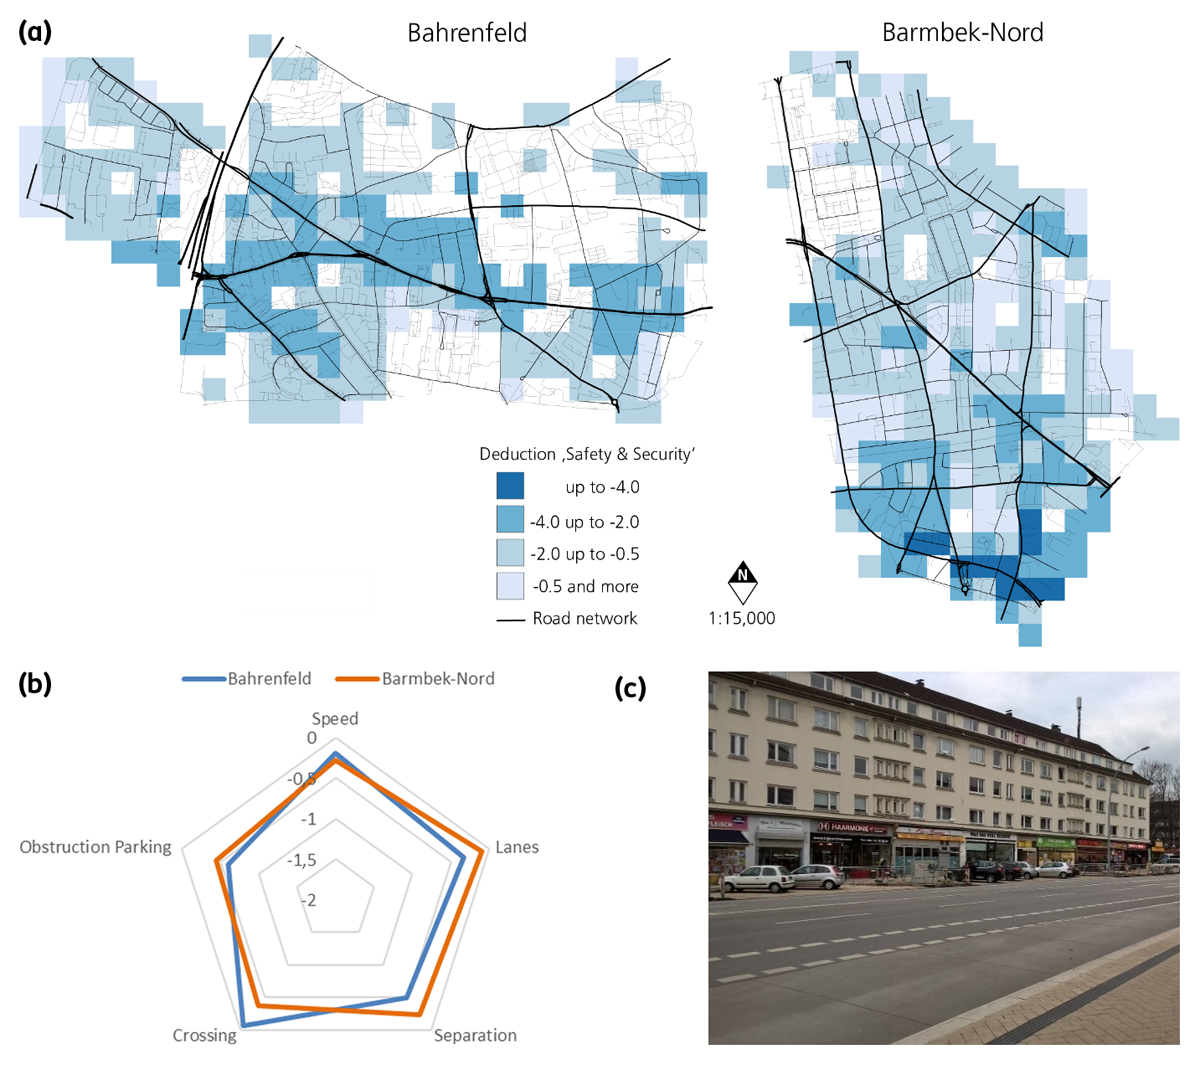
(a) Average deduction Safety and Security (in points) in Bahrenfeld and Barmbek-Nord. (b) Average deduction Safety and Security (in points). (c) Separation due to road width in Barmbek-Nord. Source: van der Vlugt.

(a) Average deduction Pleasantness (in points) in Bahrenfeld and Barmbek-Nord. (b) Average deduction Pleasantness (in points). (c) Trees along the road in Bahrenfeld. Source: van der Vlugt.
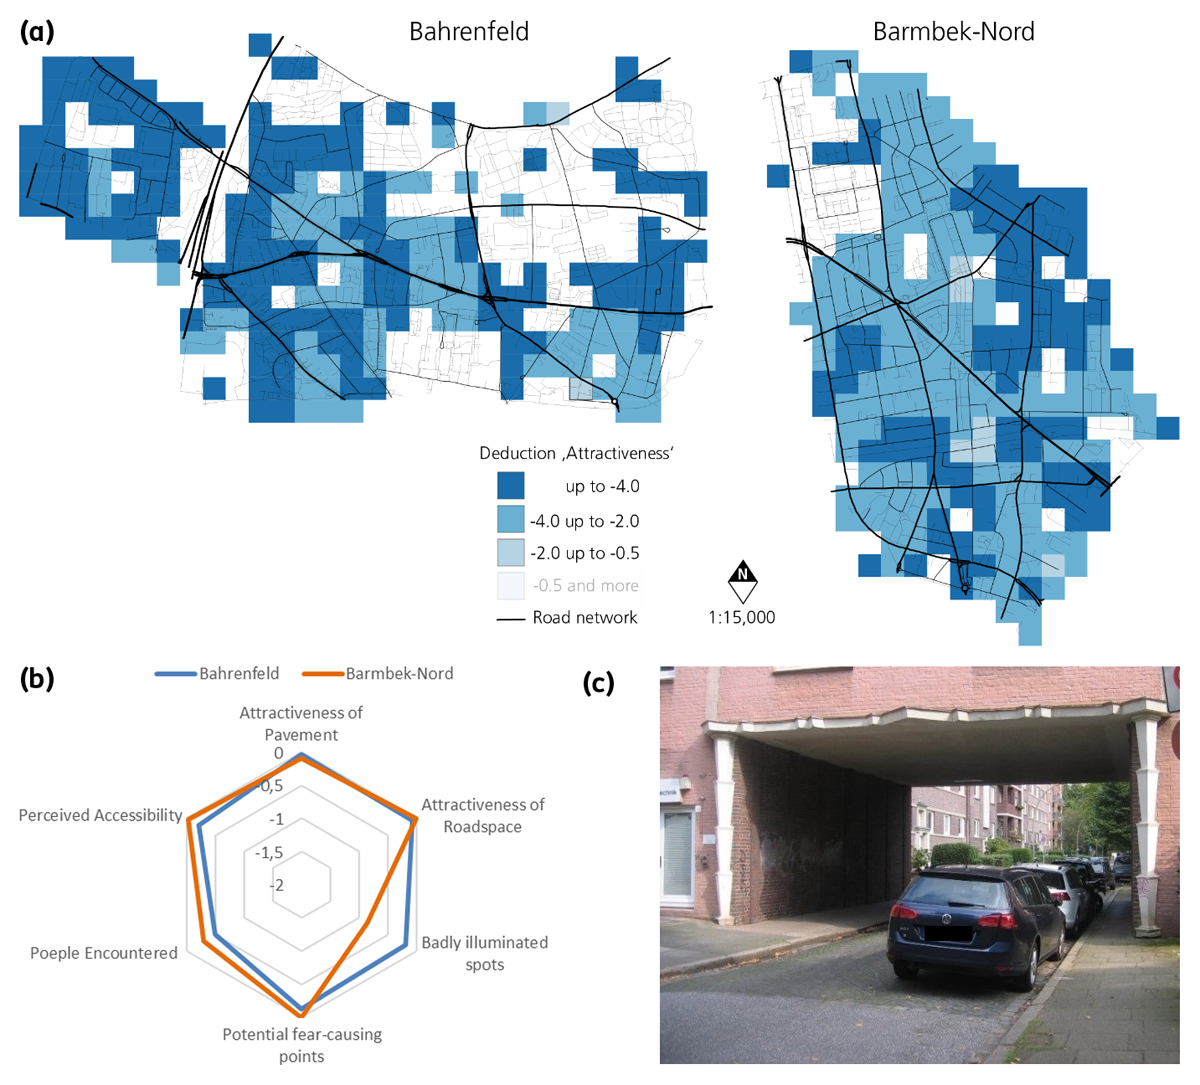
(a) Average deduction Attractiveness (in points) in Bahrenfeld and Barmbek-Nord. (b) Average deduction Attractiveness (in points). (c) Badly illuminated spot in Barmbek-Nord. Source: van der Vlugt.
The comparison of the two neighbourhoods in terms of the functionality category shows that the quality of walking is spatially varied (Figure 5a). For example, east of the A7 motorway in Bahrenfeld is characterised by deductions of up to –6.7 points. This is caused by the width of the pavements, lack of kerbstone lowering, obstructions on the pavement and the predominant lack of seating. Steps are not a problem in this area. In contrast, the southeast of the study area has significantly fewer deficiencies in this category and better walkability. While it has a similar lack of seating, the deficiencies in kerbstone lowering and obstructions on the pavement are significantly less. Pavement width is highlighted as particularly positive in this area (–0.03) and contributes to improved walkability for walking together, with a stroller or a pram in this category. In comparison, there are only isolated deductions of more than –4 points in this category in Barmbek-Nord. If areas with a higher walkability in the category are compared, the data show, for example, that in the west of Barmbek-Nord there is sufficient seating, but there are higher deductions in the area of kerbstone lowering and obstructions on the pavement. Since Figure 5a shows the entire functionality category, the explained circumstances are identifiable in the data but not visually apparent in Figure 5a.
4.1.2 Introducing the PEWI – Safety and Security
In the safety and security category, where deductions of up to –10% per route were also possible, both target areas perform better. The deficit is marginally higher in Bahrenfeld regarding the number of existing lanes (–0.34; BN: –0.1) and separation by road width (–0.5; BN: –0.23) as well as obstruction by parked cars (–0.6; BN: –0.45), while speed (BN: –0.28; B: –0.19) and the lack of crossing possibilities (BN: –0.38; B: –0.06) lead to higher deficits in Barmbek-Nord. These indicators are especially important for the target groups, since crossing options are essential for mobility restricted people or young children who cannot walk fast, do not yet have a good overview or are more often overlooked.
Turning to the grid level in Bahrenfeld, there is no deduction higher than –4 points. The deductions are concentrated along the main road, which reduces walkability due to its two-lane system (–0.79). The speed and crossing options only lead to marginal deductions. In addition to the multiple lanes, the reduction in walkability is caused by the separation due to the road width (–1.02) and the obstruction due to parking (–0.51). Although the deficit in this category is smaller in comparison, there are spatial differences and a few deductions of up to –6.45 points in Barmbek-Nord. Walkability in this area is most severely reduced by obstruction due to parking (–1.44), coupled with speed (–1.26), multiple lanes (–0.67), lack of crossing opportunities (–0.88) and separation due to road width (–0.83).
4.1.3 Introducing the PEWI - Pleasantness
In addition to the categories of ‘functionality’, as well as ‘safety and security’, that is, the physical characteristics of the environment, the categories of ‘pleasantness’ and ‘attractiveness’ represent the more subjective quality of the walking routes. Referring to table 2, deductions of up to –10% per route were possible in the Pleasantness category due to the gradation by noise pollution. Bahrenfeld performs better than Barmbek-Nord in this category. Figure 7b shows that walkability is strongly affected by noise pollution. The average deduction per grid is –1.93 in Barmbek-Nord and –1.71 in Bahrenfeld. The predominant presence of trees improves both target areas (both neighbourhoods: –0.03). This implies that trees were present in the majority of the individual segments so that only very small deductions were apparent for this indicator. Street greenery is thereby mainly represented in Bahrenfeld (B: –0.22; B-N: –1.37) and the lack of it reduces walkability in Barmbek-Nord. According to this, there was considerably less street greenery in Barmbek-Nord than in Bahrenfeld.
Bahrenfeld scored less well in the previous categories, but Figures 7a and 7b illustrate the significantly higher deductions in Barmbek-Nord in the Pleasantness category. In Bahrenfeld, trees and other street greenery are present throughout the area. The higher deductions were solely due to high noise pollution (–1.71), which leads to a significant reduction in walkability. Barmbek-Nord is characterised by high to very high deductions over a large area. These are due to the lack of other street greenery (–1.37) in addition to high noise pollution (–1.93). Similar to Bahrenfeld, trees are present over a large area (–0.03).
4.1.4 Introducing the PEWI – Attractiveness
In the last category, ‘attractiveness’, both study areas performed highest except in walking accessibility perception (Figures 8a and 8b). Whereas in the previous categories significant deductions in walkability were observed in some cases, both study areas were rated positively with regard to the attractiveness of the pavement (B: –0.04; B-N: –0.09) and the street space (B: –0.07; B-N: –0.01); the deductions were marginal, although deductions of up to –18% per route were possible in this category. In terms of safety perceptions in the neighbourhood, walkability in Barmbek-Nord deteriorates due to the occurrence of badly illuminated spots (B-N: –0.85; B: –0.19), but these are not perceived as potential fear-causing points (B-N: 0; B: –0.12). The absence of people and, consequently, the absence of encounters leads to a decrease in walkability by –0.5 points in Bahrenfeld (B-N: –0.29).
The pavement and street space are perceived as attractive across the board. The higher deductions are caused by badly illuminated spots (–0.19) and potential fear-causing points (–0.12) reducing walkability in Bahrenfeld. In Barmbek-Nord, the higher deductions are mainly caused by badly illuminated spots (–0.85). The survey team does not classify these as fear-causing points. However, since these points are perceived differently, it is important to analyse these indicators separately as factors influencing walkability. As the only variable covering the perceptions of the inhabitants, the perception of walking accessibility was weighted higher (Table 2). This explains the higher deductions compared to the other variables in this category. The inhabitants in Barmbek-Nord perceived accessibility better (–2.53) than those in Bahrenfeld (–3.48).
4.2 Does a ‘walker’s paradise’ really exist? Comparing the Walkscore and PEWI in Barmbek-Nord and Bahrenfeld
With the intention of developing an objective information, planning and decision-based instrument, the PEWI is presented in Table 3 as the outcome of integrating and considering indicators of the built environment, qualities of the walking route as well as individual walking accessibility perceptions. It depicts the descriptive results of the Walkscore and PEWI categories by target area. For the Barmbek-Nord case study, the average of objective walking accessibility (Walkscore) (Figure 9) within the target area resulted in 90 (sd = 6.78). This figure falls into a category of ‘walker’s paradise’ (Walk Score®, 2011). Our adapted version, the PEWI considering all 18 indicators shows a more nuanced picture of current walkability with an average of 80 (sd = 5.15), a very walkable category. In order to find out whether the Walkscore differs on average from the PEWI, a comparison of mean values was carried out. Accordingly, a t-test was used to compare the mean values of the Walkscore with the mean values of the PEWI. The t-test shows a significant difference between the Walkscore and the PEWI t (44.63) = 208 (p < 0.01).
Descriptions of the Walkscore and PEWI.
| Walkscore | Perceived Environment Walking Index (PEWI) | |
| Barmbek-Nord | ||
| Mean (sd) | 89.88 (6.78) | 79.86 (5.15) |
| Min | 71.16 | 64.95 |
| Max | 99.15 | 91.95 |
| Bahrenfeld | ||
| Mean (sd) | 76.62 (12.08) | 67.91 (10.38) |
| Min | 23.27 | 21.93 |
| Max | 92.15 | 84.56 |
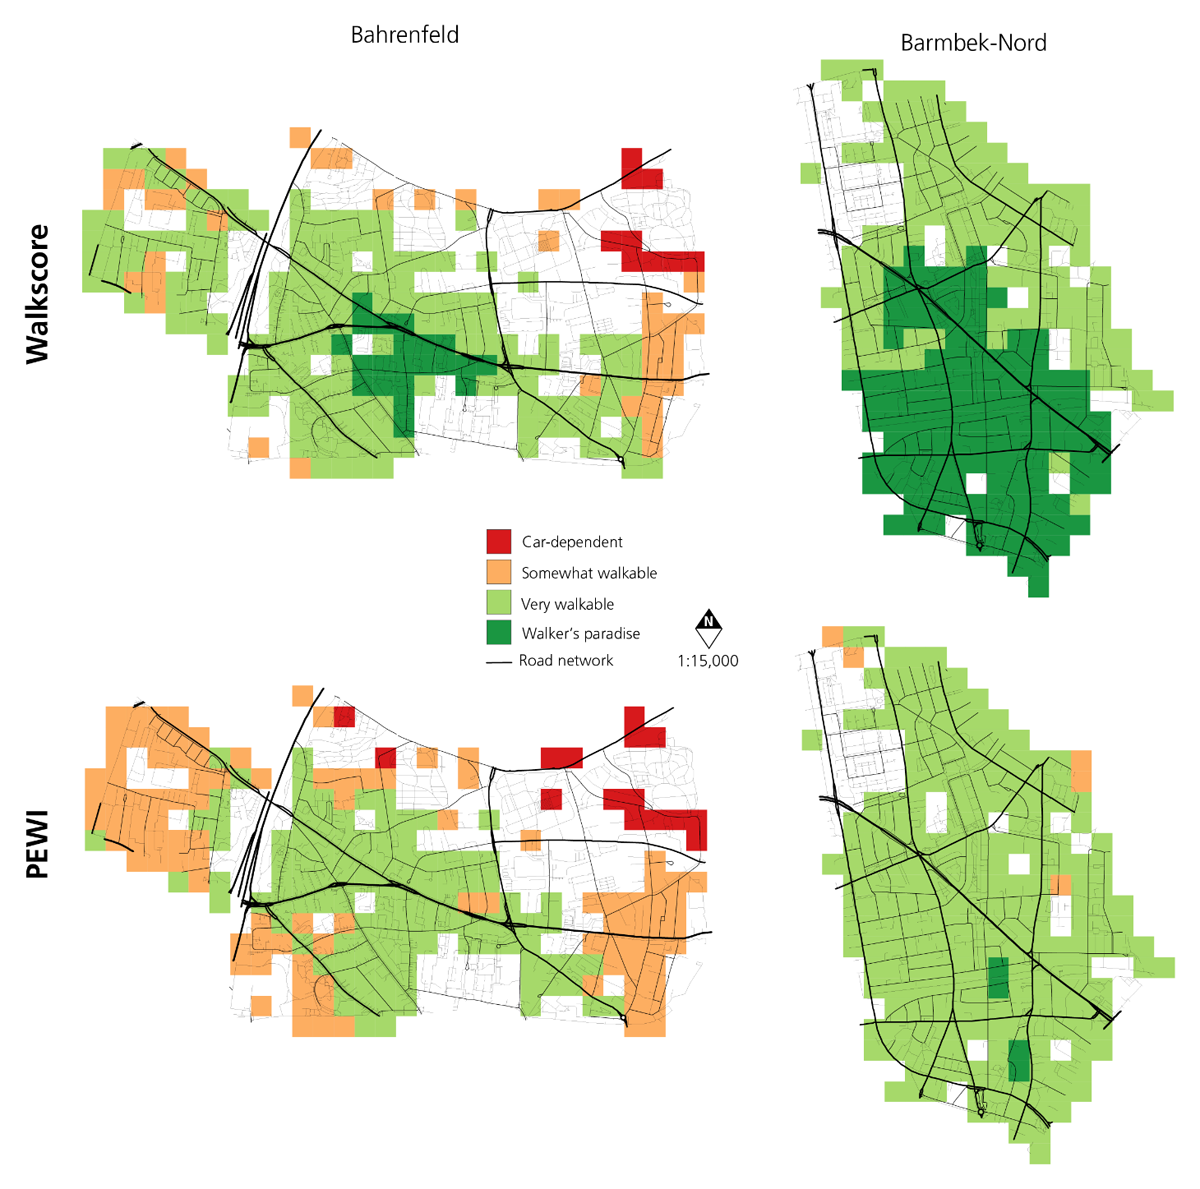
Walkscore and PEWI in Bahrenfeld und Barmbek-Nord.
By comparing the two figures, it can be seen that Barmbek-Nord’s PEWI and therefore its walkability drops extensively from the highest category to very walkable. In some parts, walkability in Barmbek-Nord has changed to the category somewhat walkable (north-east). In the south, a small part remained in the walker’s paradise category. In the Bahrenfeld case study, the average of objective walking accessibility (Figure 9) was 76 (sd = 12.08) and fell into the very walkable category. If we take PEWI into account (Figure 9), walkability deteriorates on average to 68 (sd = 10.38), somewhat walkable. The Walkscore shows a small walker’s paradise in the centre of Bahrenfeld. This category is no longer present in the PEWI (very walkable). In the southwest, walkability changes from very walkable into somewhat walkable. In the northeast, even grid cells fall in terms of their walkability from somewhat walkable into car dependent. The comparison highlights the limitation of common methods based on distances to the nearest facilities. They do not consider qualities of the walking routes which can decrease the walkability of an area. In line with D’Orso and Migliore (2020), the results show the importance of integrating a variety of walkability indicators to prevent people from preferring to take their car, instead of walking, and creating noisy and unattractive walking environments themselves. Finally, it is possible with the PEWI to identify priorities for interventions, spatially represent and contribute to developing walkable environments and ultimately promote active mobility for all population groups (D’Orso and Migliore, 2020).
5 Discussion and Conclusion
This paper investigated multiple relations between different dimensions of the walkability concept, discussed methodologies for assessing walkability in urban neighbourhoods and presents the development of the Perceived Environment Walking Index (PEWI). To the best of our knowledge, this study represents one of the first studies to integrate so many aspects of walkability and subjective perceptions in a coherent instrument.
With the overall intention of improving the modal share of walking and therefore enhancing individual well-being and reducing the negative effects of sedentary lifestyles, a wide range of literature from different disciplines and research focuses on newly developed walkability indicators and tests their validity in different spatial levels and with different methodologies.
Despite these considerable efforts, there is often a lack of reflection on objectively determined accessibility conditions with subjective perceptions of neighbourhood residents, who ultimately shape mobility decisions. This is also in line with De Vos et al. (2019), who demanded a detailed understanding of the user-specific experience of urban environments, different types of infrastructure and traffic situations. So, this paper can be read as responding to recent calls for more research in this area (Curl, 2013; Lättman, 2018) and the need for consistent methods to collect and integrate several features that affect walking. We integrated and analysed the influence of subjective perceptions of walking accessibility as well as 18 walkability indicators on an existing accessibility instrument by developing an adapted version of the Walkscore, the PEWI.
Therefore, we used a multi-method study design and identified indicators that give a more nuanced description of the influence of the built environment on the walkability of the target groups in order to expand small-scale accessibility models. We developed and tested the PEWI in two urban neighbourhoods in Hamburg in three steps. Firstly, we calculated the Walkscore that represents objective walking accessibility and added two facilities to be accessed and adjusted their weightings according to the target groups. Second, we developed the PEWI on this basis by integrating 18 walkability indicators representing physical features as well as the quality of the walking route and subjective perceptions of walking accessibility. Subsequent equal weighting of input variables allowed the influence of each indicator to be elaborated and visualised in GIS. The results illustrate how individual perceptions can be integrated with physical features of the environment and qualities of the walking route into a group-specific indicator. The data collection was based on a systematic neighbourhood audit. The subjective perceptions were collected in a household survey.
The PEWI illustrates the local provision of facilities and services taking into account the quality of walking. Comparing the two neighbourhoods shows clear differences. The study area in Bahrenfeld has a low quality in the functionality category, that is, kerbstone lowering, obstacles, available seating and pavement width. These indicators are particularly important for people with limited mobility, such as older people walking with a stroller or stick or young families with a pram or a little baby bicycle. The needs of these vulnerable groups must be taken into account to prevent social exclusion and to enable an independent, self-determined life. In the study area in Barmbek-Nord, the highest deficit is in the pleasantness category. Noise pollution in the neighbourhood is the highest negative factor influencing walkability. In the attractiveness category, both districts perform best except for walking accessibility perceptions.
Using the PEWI in the two study areas leads us to three conclusions regarding our research questions. First, the survey methods of a neighbourhood audit and the integration of the indicators into an existing accessibility tool have proven to be a promising, nuanced method to get a more accurate picture of walkability and accessibility. Equal weighting of all indicators except for noise pollution and perceived walking accessibility allows a comparative analysis of the influence of all indicators, the built environment as well as the qualities of the walking route.
Second, regarding the effects for small-scale accessibility analysis, the PEWI enables detailed deficits to be shown spatially on a micro level and thus walkability to be analysed on a grid level (100m × 100m). The variety of indicators not only allows focus on individual aspects, but also a holistic analysis that includes not just noise pollution and pavement width, but also traffic volume and qualities, such as the attractiveness of the street space or street greenery.
Finally, the difference between Walkscore and the PEWI shows that commonly used indices, focusing only on distances or travel times, are not sufficient to represent the lived reality of accessibility and walkability and cannot incorporate target group-specific perceptions. In line with van der Vlugt et al. (2022) and Gorrini and Bandini (2018) we conclude that integrating perceptions as well as user-specific needs is highly relevant when studying individuals’ travel decisions.
The present research elaborated an urgent need for action in planning practice. In line with Curl et al. (2011) as well as van der Vlugt et al. (2022), there should be more responsibility for planners to develop opportunities for more walkable environments. The PEWI can function as a basis for planning practice to identify deficits in a particular area at micro level. Concepts can be developed on this basis. In this way, accessibility planning could avoid the criticism of assuming the homogeneity of a society by only involving distances or travel time. It could contribute to ensuring social inclusion by integrating the needs of different target groups, especially vulnerable groups like older people or children, in future planning. The PEWI shows, for example, where there is a shortage of seating, where to initiate crime-prevention measures, where to focus on pedestrian infrastructure. The PEWI can function as a toolbox illustrating the effects of individual indicators. Depending on the issue, planning practitioners can use these indicators to get a more nuanced picture of walkability and have the opportunity to use an instrument that approaches representing the ‘lived reality’ of accessibility and walkability.
The study has some limitations. The large number of indicators integrated in the PEWI is valuable and unique, but it significantly increases the complexity of the analysis. On the one hand, with regard to the neighbourhood’s audit, it is questionable whether so much detail at segment level is feasible for planning practice. The integration of a wide range of indicators is an immense added value of the PEWI. Nevertheless, there is a need for discussion with regard to individual indicators. For example, green spaces are integrated in the form of trees or other roadside greenery. However, the quantity is measured, and the quality of the green spaces is not included but merely investigated via the attractiveness of the pavement or streetscape design. The indicators ‘badly illuminated spots’ and ‘potential fear-causing points’ were surveyed during the day. The after-dark perception, which has been identified as an influencing factor for the perception of accessibility (van der Vlugt et al., 2019), is accordingly not represented. The objective indicators, such as pavement width measured in metres, number of lanes or presence of green space, can be objectively recorded by the survey team without bias. The quality of the pavement and classification of an area as a potential fear-causing point, as well as any attractiveness factors, are a more subjective reflection of the researchers’ perception. Perceptions of safety in particular are highly subjective. Therefore, we did not use potential fear points and badly illuminated spots as a restriction, but instead added a deficit to account for the variability of perceptions. It is not forbidden to pass through the fear-inducing points in the calculation, but the route will still have a deduction. The indicator ‘perceived accessibility’ could not be queried in every grid cell because we used a random sample. Accordingly, perceptions were not integrated across the board, but transferred to nearby grids through interpolation. The indicators ‘people encountered’ and ‘obstruction through parking’ suffer from bias due to their time dependence. We tried to compensate for this bias by collecting the data on segment level and not on point level.
Another limitation refers to the third strand of walkability research outlined in Section 2.2, the capability approach. With the aim of integrating hindering factors related to walkability, we intend to give actors the opportunity to derive recommendations for action and thus maximise freedom and opportunity through the expansion of options for action. Several conversion factors were integrated into the PEWI in order to give opportunities to convert conditions and commodities into functionings, for example: numerous features of the built environment, such as lowered kerbs, width of the pavement or available seating. However, individual specifics, such as personal resources, mobility limitations, health status, individual attitudes, which are important factors in shaping perceptions, could not be included in the index. The factor of perceived walking accessibility contains the personal assessment of walking accessibility but cannot consider the individual values that lead to the assessment.
Moreover, it would have been possible to weight the deductions of perceived accessibility higher in order to give more space to the perceptions of accessibility. In this case, the index would only reflect the perceptions of the target groups. However, depending on the practical planning intention, for example regarding age-appropriate neighbourhood development, this would be quite conceivable. Furthermore, studies, such as van der Vlugt et al. (2019), show that the integrated indicators that represent the topic of barrier-free environment, safety and attractiveness have significant influences on the perception of accessibility of precisely these target groups. Therefore, a wide range of indicators has a decisive influence on people’s perception that we already integrated in the PEWI.
In addition, agglomeration effects may emerge with the high number of indicators. For example, on a two-lane street, higher speeds are allowed, which in turn generate higher noise levels. Therefore, an equal weighting of all indicators was chosen. This allows for an equal accumulation of the deductions. The neighbourhood audit was based on the administrative district boundaries, but since facilities outside the administrative boundaries are also located within the 500m walking radius and are therefore included in the objective accessibility calculation, data are incomplete for segments at the edges of the study area.
Further research is also needed regarding the integration of qualitative methods to collect more detailed perceptions of different user groups. The PEWI tried to integrate user-specific needs and perceptions, but subjective motives and assessments are highly varied. Integrating focus groups, in-depth interviews and neighbourhood walks, would make it possible to obtain an improved understanding of different motives, needs and assessments. This could also take into account the different perceptions of safety and security. Especially for vulnerable groups, such as older people or children, it is worth analysing them separately with the help of qualitative methods, for example walk-alongs. Even though they seem to have similar needs and preferences with regard to walkability (Warner and Zhang, 2019), by interviewing them while walking, a specific focus is placed on the experience of the space and the possibility for exchange about impressions and emotions (Stals et al., 2014). Therefore, the researcher as well as the interviewee can react directly, and we can gain a deeper understanding of the specific needs and preferences of these groups and help to plan target group specific walkability in cities. With this type of interview, it would also be possible to learn more about personal resources, mobility limitations, health status and individual attitudes in relation to the capability approach. There is also a need to use digital assessment methods like ICT-based tools. These have the potential to actively integrate the population into the analysis in the form of a citizen science approach. With the help of an app, people can digitally enter factors that promote and hinder walkability. In addition, the use of online map services with 360-degree views of the street, such as Google Street View, can reduce the survey effort (Cleland et al., 2021). The PEWI is a holistic tool for analysing walkability and the local provision of facilities and services. It would be a big effort to combine this with action radii and the actual activity patterns in a neighbourhood, including health data (for example with an accelerometer). Combined with the PEWI, it would make a major contribution to shaping future planning in a target group-specific manner.
Competing Interests
The authors have no competing interests to declare.
References
1 Adkins, A., Dill, J., Luhr, G. A. and Neal., M. B. (2012). Unpacking walkability: testing the influence of urban design features on perceptions of walking environment attractiveness. Journal of Urban Design, 17(4), 499–510. DOI: http://doi.org/10.1080/13574809.2012.706365
2 Ahlmeyer, F. and Wittwosky, D. (2018). What do we need in rural areas? How to use accessibility modelling as a strategy in transport planning. Raumforschung und Raumordnung | Spatial Research and Planning, 76, 531–550. DOI: http://doi.org/10.1007/s13147-018-0558-8
3 Alfonzo, M. A. (2005). To walk or not to walk? The hierarchy of walking needs. Environment and Behaviour, 37(6), 808–836. DOI: http://doi.org/10.1177/0013916504274016
4 Amaya, V., Moulaert, T., Gwiazdzinski, L. and Vuillerme, N. (2022). Assessing and qualifying neighborhood walkability for older adults: construction and initial testing of a multivariate spatial accessibility model. Int J Environ Res Public Health, 19(3), 1808. DOI: http://doi.org/10.3390/ijerph19031808
5 Bader, M. D. M., Mooney, S. J., Lee, Y. J., Sheehan, D., Neckerman, K. M., Rundle, A. G. and Teitler, J. O. (2015). Development and deployment of the Computer Assisted Neighborhood Visual Assessment System (CANVAS) to measure health-related neighborhood conditions. Health & Place, 31, 163–172. DOI: http://doi.org/10.1016/j.healthplace.2014.10.012
6 Bartshe, M., Coughenour, C. and Pharr, J. (2018). Perceived walkability, social capital, and self-reported physical activity in Las Vegas college students. Sustainability, 10(9), 3023. DOI: http://doi.org/10.3390/su10093023
7 Bereitschaft, B. (2021). Older adult population and neighborhood walkability by metropolitan area size and degree of urban sprawl. Papers in Applied Geography, 249–267. DOI: http://doi.org/10.1080/23754931.2021.1978526
8 Berke, E., Koepsell, T., Moudon, A., Hoskins, R. and Larson, E. (2007). Association of the built environment with physical activity and obesity in older persons. Am J Public Health, 97, 486–492. DOI: http://doi.org/10.2105/AJPH.2006.085837
9 Berry, N.M., Coffee, N. T., Nolan, R., Dollman, J. and Sugiyama, T. (2017). Neighbourhood environmental attributes associated with walking in South Australian adults: differences between urban and rural areas. International Journal of Environmental Research and Public Health, 14(9), 965. DOI: http://doi.org/10.3390/ijerph14090965
10 Bias, T. K., Leyden, K. M., Abildso, C. G., Reger-Nash, B. and Bauman, A. (2010). The importance of being parsimonious: reliability of a brief community walkability assessment instrument. Health & Place, 16(4), 755–758. DOI: http://doi.org/10.1016/j.healthplace.2010.01.008
11 Blecic, I., Cecchini, A., Congiu, T., Fancello, F., Fancello, G. and Trunfio, G. A. (2015). Evaluating walkability: a capability-wise planning and design support system. International Journal of Geographical Information Science, 29(8), 1350–1374. DOI: http://doi.org/10.1080/13658816.2015.1026824
12 Blecic, I., Congiu, T., Fancello, G. and Trunfio, G. (2020). Planning and design support tools for walkability: a guide for urban analysts. Sustainability , 12 (11), 4405. DOI: http://doi.org/10.3390/su12114405
13 Bödeker, M., Finne, E., Kerr, J. and Bucksch, J. (2018). Active travel despite motorcar access. A city-wide, GIS-based multilevel study on neighborhood walkability and active travel in Germany. Journal of Transport & Health, 9, 8–18. DOI: http://doi.org/10.1016/j.jth.2018.03.009
14 Bradshaw, C. (1993). Creating and using a rating system for neighborhood walkability: towards an agenda for “local heroes.” Paper presented at the 14th International Pedestrian Conference, Boulder, CO.
15 Brown, B. B. and Jensen, W. A. (2020). Dog ownership and walking: perceived and audited walkability and activity correlates. International Journal of Environmental Research and Public Health, 17(4), 1385. DOI: http://doi.org/10.3390/ijerph17041385
16 Bundesministerium für Verkehr und digitale Infrastruktur (BMVI). (2018). Mobilität in Deutschland. Tabellarische Grundauswertung. Available from https://www.mobilitaet-in-deutschland.de/archive/pdf/MiD2017_Tabellenband_Deutschland.pdf [Accessed 15 August 2023].
17 Cao, S., Mokhtarian, P. L. and Handy, S. L. (2009). Examining the impacts of residential self-selection on travel behaviour: a focus on empirical findings. Transport Reviews, 29(3), 359–395. DOI: http://doi.org/10.1080/01441640802539195
18 Carr, L. J., Dunsiger, S. I. and Marcus, B. H. (2010). Walk ScoreTM as a global estimate of neighborhood walkability. American Journal of Preventive Medicine, 39(5), 460–463. DOI: http://doi.org/10.1016/j.amepre.2010.07.007
19 Carr, L. J., Dunsiger, S. I. and Marcus, B. H. (2011). Validation of Walk Score for estimating access to walkable amenities. British Journal of Sports Medicine, 45(14), 1144–1148. DOI: http://doi.org/10.1136/bjsm.2009.069609
20 Cervero, R. and Kockelman, K. (1997). Travel demand and the 3Ds: density, diversity, and design. Transportation Research Part D: Transport and Environment, 2(3), 199–219. DOI: http://doi.org/10.1016/S1361-9209(97)00009-6
21 Chudyk, A. M., Winters, M., Moniruzzaman, Md., Ashe, M. C., Gould, J. S. and McKay, H. (2015). Destinations matter: The association between where older adults live and their travel behavior. Journal of Transport & Health, 2(1), 50–57. DOI: http://doi.org/10.1016/j.jth.2014.09.008
22 Cleland, C. L., Ferguson, S., Kee, F., Kelly, P., Williams, A. J., Nightingale, G., Cope, A., Foster, C., Milton, K., Kelly, M. P., Jepson, R. and Hunter, R. F. (2021). Adaptation and testing of a microscale audit tool to assess liveability using google street view: MAPS-liveability. Journal of Transport & Health, 22. DOI: http://doi.org/10.1016/j.jth.2021.101226
23 Clifton, K. J., Livi Smith, A. D. and Rodriguez, D. (2007). The development and testing of an audit for the pedestrian environment. Landscape and Urban Planning, 80(1–2), 95–110. DOI: http://doi.org/10.1016/j.landurbplan.2006.06.008
24 Consoli, A., Nettel-Aguirre, A., Spence, J. C., McHugh, T.-L., Mummery, K. and McCormack, G. R. (2020). Associations between objectively measured and self-reported neighbourhood walkability on adherence and steps during an internet-delivered pedometer intervention. PLoS ONE, 15(12): e0242999. DOI: http://doi.org/10.1371/journal.pone.0242999
25 Curl, A. (2013). Measuring what matters: comparing the lived experience to objective measures of accessibility. University of Aberdeen. DOI: http://doi.org/10.13140/RG.2.1.3374.3601
26 Curl, A., Nelson, J. D. and Anable, J. (2011). Does accessibility planning address what matters? A review of current practice and practitioner perspectives. Research in Transportation Business & Management, 2, 3–11. DOI: http://doi.org/10.1016/j.rtbm.2011.07.001
27 Curl, A., Nelson, J. D. and Anable, J. (2015). Same question, different answer: a comparison of GIS-based journey time accessibility with self-reported measures from the National Travel Survey in England. Computers, Environment & Urban Systems, 49, 86–97. DOI: http://doi.org/10.1016/j.compenvurbsys.2013.10.006
28 Currie, G. and Stanley, J. (2008). Investigating links between social capital and public transport. Transport Reviews, 28(4), 529–547. DOI: http://doi.org/10.1080/01441640701817197
29 D’Alessandro, D., Appolloni, L. and Capasso, L. (2016). How walkable is the city? Application of the walking suitability index of the territory (T-WSI) to the city of Rieti (Lazio region, Central Italy). Epidemiol Prev, 40(3–4), 237–242.
30 D’Orso, G. and Migliore, M. (2020). A GIS-based method for evaluating the walkability of a pedestrian environment and prioritised investments. Journal of Transport Geography, 82, 102555. DOI: http://doi.org/10.1016/j.jtrangeo.2019.102555
31 De Vos, J., Lättman, K., van der Vlugt, A-L., Welsch, J. and Otsuka, N. (2023). Determinants and effects of perceived walkability: a literature review, conceptual model and research agenda. Transport Reviews, 43(2), 303–324. DOI: http://doi.org/10.1080/01441647.2022.2101072
32 De Vos, J., Schwanen, T., Van Acker, V. and Witlox, F. (2019). Do satisfying walking and cycling trips result in more future trips with active travel modes? An exploratory study. Int. J. Sustain. Transp., 13(3), 180–196. DOI: http://doi.org/10.1080/15568318.2018.1456580
33 Duncan, D., Aldstadt, J., Whalen, J., Melly, S. and Gortmaker, S. L. (2011). Validation of Walk Score® for estimating neighborhood walkability: an analysis of four US metropolitan areas. Int. J. Environ. Res. Public Health, 8(11), 4160–4179. DOI: http://doi.org/10.3390/ijerph8114160
34 Duncan, D. T., Méline, J., Kestens, Y., Day, K., Elbel, B., Trasande, L. and Chaix, B. (2016). Walk score, transportation mode choice, and walking among French adults: a GPS, accelerometer, and mobility survey study. Int. J. Environ. Res. Public Health, 13(6), 611. DOI: http://doi.org/10.3390/ijerph13060611
35 European Commission. Noise. Available from https://ec.europa.eu/environment/noise/health_effects_en.htm [Accessed 20 April 2022].
36 European Environment Agency. (2020). Environmental noise in Europe — 2020. Luxembourg. Available from https://www.eea.europa.eu/publications/environmental-noise-in-europe [Accessed 20 April 2022].
37 Ewing, R. (1999). Pedestrian and transit-friendly design: a primer for smart growth. ICMA, Washinton D.C.
38 Ewing, R. and Cervero, R. (2010). Travel and the built environment. A meta-analysis. Journal of the American Planning Association, 76(3), 265–294. DOI: http://doi.org/10.1080/01944361003766766
39 Ewing, R. and Handy, S. (2009). Measuring the unmeasurable. Urban design qualities related to walkability. Journal of Urban Design, 14(1), 65–84. DOI: http://doi.org/10.1080/13574800802451155
40 Fancello, G., Congiu, T. and Tsoukias, A. (2020). Mapping walkability. A subjective value theory approach. Socio-economic Planning Sciences, 72, 100923. DOI: http://doi.org/10.1016/j.seps.2020.100923
41 Fina, S., Gerten, C., Pondi, B., D’Arcy, L., O’Reilly, N., Vale, D.S., Pereira, M. and Zilio, S. (2022). OS-WALK-EU: An open-source tool to assess health-promoting residential walkability of European city structures. Journal of Transport & Health, 27, 101486. DOI: http://doi.org/10.1016/j.jth.2022.101486
42 Frank, L. D., Kershaw, S., Chapman, J. E., Campbell, M. and Swinkels, H. M. (2015). The unmet demand for walkability: disparities between preferences and actual choices for residential environments in Toronto and Vancouver. Canadian Journal of Public Health, 106(1), 12–20. DOI: http://doi.org/10.17269/cjph.106.4397
43 Frank, L. D., Saelens, B. E., Powell, K. E. and Chapman, J. E. (2007). Stepping towards causation: do built environments or neighborhood and travel preferences explain physical activity, driving, and obesity? Social Science & Medicine, 65(9), 1898–1914. DOI: http://doi.org/10.1016/j.socscimed.2007.05.053
44 Frank, L. D., Sallis, J. F., Saelens, B. E., Leary, L., Cain, K., Conway, T. L. and Hess, P. M. (2009). The development of a walkability index: application to the Neighborhood Quality of Life Study. British Journal of Sports Medicine, 44(13), 924–933. DOI: http://doi.org/10.1136/bjsm.2009.058701
45 Frank, L. D., Schmid, T. L., Sallis, J. F., Chapman J. and Saelens, B. E. (2005). Linking objectively measured physical activity with objectively measured urban form. Findings from SMARTRAQ. American Journal of Preventive Medicine, 28(2), 117–125. DOI: http://doi.org/10.1016/j.amepre.2004.11.001
46 Galanis, A. and Eliou, N. (2011). Evaluation of the pedestrian infrastructure using walkability indicators. WSEAS Trans. Environ. Dev., 7(12), 385–394.
47 García-Carpintero, M. Á., de Diego-Cordero, R., Pavón-Benítez, L. and Tarriño-Concejero, L. (2022). ‘Fear of walking home alone’: urban spaces of fear in youth nightlife. European Journal of Women’s Studies, 29(1), 39–53. DOI: http://doi.org/10.1177/1350506820944424
48 Gardner, K., Johnson, T., Buchan, K. and Pharoah, T. (1996). Developing a pedestrian strategy for London. In Proceedings of the Transport Policy and Its Implementation, Uxbridge, UK, 2–6.
49 Gebel, K., Bauman, A. E., Sugiyama, T. and Owen, N. (2011). Mismatch between perceived and objectively assessed neighborhood walkability attributes: prospective relationships with walking and weight gain. Health & Place, 17(2), 519–524. DOI: http://doi.org/10.1016/j.healthplace.2010.12.008
50 Geurs, K. T. and van Wee, B. (2004). Accessibility evaluation of land-use and transport strategies: review and research directions. Journal of Transport Geography, 12(2), 127–140. DOI: http://doi.org/10.1016/j.jtrangeo.2003.10.005
51 Glazier, R. H., Weyman, J. T., Creatore, M. I., Gozdyra, P., Moineddin, R., Matheson, F. I. and Booth, G. L. (2012). Development and validation of an urban walkability index for Toronto, Canada. Toronto Commu. Health Profile Partnersh. Available from http://www.torontohealthprofiles.ca/a_documents/aboutTheData/12_1_ReportsAndPapers_Walkability_WKB_2012.pdf [Accessed 1 August 2022].
52 Göddecke-Stellmann, J. (2013). Stadtbeobachtung im BBSR auf neuen Wegen. In: BBSR – Bundesinstitut für Bau-, Stadt- und Raumforschung (Ed.), Informationen aus der Forschung des BBSR 2. Bonn, 5. Available from https://www.bbsr.bund.de/BBSR/DE/Veroeffentlichungen/BBSRInfo/2013_2014/DL_2_2013.pdf?__blob=publicationFile&v=4 [Accessed 1 August 2022].
53 Gorrini, A. and Bandini, S. (2018). Elderly walkability index through GIS: towards advanced AI-based simulation models. Conference Paper. Available from http://ceur-ws.org/Vol-2333/paper5.pdf [Accessed 1 November 2022].
54 Hall, C. M. and Ram, Y. (2018). Walk Score® and its potential contribution to the study of active transport and walkability: a critical and systematic review. Transportation Research Part D: Transport and Environment, 61, 310–324. DOI: http://doi.org/10.1016/j.trd.2017.12.018
55 Handy, S. and Clifton, K. (2001). Evaluating neighborhood accessibility: possibilities and practicalities. Journal of Transportation and Statistics, 4(2), 67–78.
56 Hansen, W. G. (1959). How accessibility shapes land use. Journal of the American Planning Association, 25(2), 73–76. DOI: http://doi.org/10.1080/01944365908978307
57 Hinckson, E., Cerin, E., Mavao, S., Smith, M., Badland, H., Stewart, T., Duncan, S. and Schofield, G. (2017). Associations of the perceived and objective neighborhood environment with physical activity and sedentary time in New Zealand adolescents. International Journal of Behavioural Nutrition and Physical Activity, 14, 145. DOI: http://doi.org/10.1186/s12966-017-0597-5
58 Jensen, W. A., Brown, B. B., Smith, K. R., Brewer, S. C., Amburgey, J. W. and McIff, B. (2017). Active transportation on a complete street: perceived and audited walkability correlates. International Journal of Environmental Research and Public Health, 14(9), 1014. DOI: http://doi.org/10.3390/ijerph14091014
59 Kabisch, S., Steinführer, A. and Haase, A. (2012). Reurbanisierung aus soziodemographischer Perspektive: Haushalte und Quartierswandel in der inneren Stadt. Brake, K., Herfert, G. (Eds.), Reurbanisierung. Springer, 113–129. DOI: http://doi.org/10.1007/978-3-531-94211-7_7
60 Kaup, S. and Rieffel, P. (2013). Rasterbasierte Regionalstatistik. ILS-TRENDS 2/13. Dortmund.
61 Kelly, C. E., Tight, M. R., Hodgson, F. C. and Page, M. W. (2011). A comparison of three methods for assessing the walkability of the pedestrian environment. J. Transp. Geogr., 19(6), 1500–1508. DOI: http://doi.org/10.1016/j.jtrangeo.2010.08.001
62 Kerr, J., Rosenberg, D. and Frank, L. (2012). The role of the built environment in healthy aging: community design, physical activity, and health among older adults. Journal of Planning Literature, 27(1) 43–60. DOI: http://doi.org/10.1177/0885412211415283
63 Killingsworth, R., Earp, J. and Moore, R. (2003). Supporting health through design: challenges and opportunities. Am. J. Health Promot., 18(1), 1–2. DOI: http://doi.org/10.4278/0890-1171-18.1.1
64 Lättman, K. (2018). Perceived accessibility. Living a satisfactory life with help of the transport system. Karlstad.
65 Lättman, K., Olsson L. E. and Friman, M. (2016). Development and test of the Perceived Accessibility Scale (PAC) in public transport. Journal of Transport Geography, 54, 257–263. DOI: http://doi.org/10.1016/j.jtrangeo.2016.06.015
66 Leyden, K. M. (2003). Social capital and the built environment: the importance of walkable neighborhoods. Am. J. Public Health, 93, 1546–1551. DOI: http://doi.org/10.2105/AJPH.93.9.1546
67 Li, F., Fisher, K. J., Brownson, R. C. and Bosworth, M. (2005). Multilevel modelling of built environment characteristics related to neighborhood walking activity in older adults. J Epidemiol Community Health, 59, 558–564. DOI: http://doi.org/10.1136/jech.2004.028399
68 Litman, T. A. (2003). Measuring transportation: traffic, mobility and accessibility: ITE Journal, 73(10), 28–32.
69 Lui, C. K. L. and Wong, T. W. L. (2021). Associations among perceived walkability of neighborhood environment, walking time, and functional mobility by older adults: an exploratory investigation. Ageing International, 47, 477–490. DOI: http://doi.org/10.1007/s12126-021-09449-3
70 Ma, L. and Cao, J. (2019). How perceptions mediate the effects of the built environment on travel behavior? Transportation, 46, 175–197. DOI: http://doi.org/10.1007/s11116-017-9800-4
71 Manson, J. E., Greenland, P., LaCroix, A., Stefanick, M. L., Mouton, C. P., Oberman, A., Perri, M. G., Sheps, D. S., Pettinger, M. B. and Siscovick, D. S. (2002). Walking compared with vigorous exercise for the prevention of cardiovascular events in women. The New England Journal of Medicine, 347(10), 716–725. DOI: http://doi.org/10.1056/NEJMoa021067
72 Manzolli, J. A., Oliveira, A. and de Castro Neto, M. (2021). Evaluating walkability through a multi-criteria decision analysis approach: a Lisbon case study. Sustainability, 13(3), 1450. DOI: http://doi.org/10.3390/su13031450
73 Moudon, A. V., Lee, C., Cheadle, A. D., Garvin, C., Johnson, D., Schmid, T. L., Weathers, R. D. and Lin, L. (2006). Operational definitions of walkable neighborhood: theoretical and empirical insights. J. Phys. Act. Health, 3, 99–117. DOI: http://doi.org/10.1123/jpah.3.s1.s99
74 Moura, F., Cambra, P. and Gonçalves, A. B. (2017). Measuring walkability for distinct pedestrian groups with a participatory assessment method: a case study in Lisbon. Landsc. Urban. Plan., 157, 282–296. DOI: http://doi.org/10.1016/j.landurbplan.2016.07.002
75 Neutze, M. (2015). Gitterbasierte Auswertungen des Zensus 2011. Stadtforschung und Statistik 2, 64–67.
76 Oakil, A. T. MB., Manting, D. and Nijland, H. (2016). Dynamics in car ownership: the role of entry into parenthood. European Journal of Transport and Infrastructure Research, 16(4). DOI: http://doi.org/10.18757/EJTIR.2016.16.4.3164
77 Otsuka, N., Wittowsky, D., Damerau, M. and Gerten, C. (2021). Walkability assessment for urban areas around railway stations along the Rhine-Alpine Corridor. J. Transp. Geogr., 93, 103081. DOI: http://doi.org/10.1016/j.jtrangeo.2021.103081
78 Papa, E. and Bertolini, L. (2015). Accessibility and transit-oriented development in European metropolitan areas. J. Transp. Geogr., 47, 70–83. DOI: http://doi.org/10.1016/j.jtrangeo.2015.07.003
79 Perez, D. F., Ritvo, P. G., Brown, P. E., Holowaty, E. and Ardern, C. (2011). Perceived walkability, social support, age, native language, and vehicle access as correlates of physical activity: a cross-sectional study of low-socioeconomic status, ethnic, minority women. Journal of Physical Activity & Health, 8(8), 1098–1107. DOI: http://doi.org/10.1123/jpah.8.8.1098
80 Pikora, T. J., Bull, F. C. L., Jamrozik, K., Knuiman, M., Giles-Corti, B. and Donovan, R. J. (2002). Developing a reliable audit instrument to measure the physical environment for physical activity. Am. J. Prev. Med. 23 (3), 187–194. DOI: http://doi.org/10.1016/S0749-3797(02)00498-1
81 Pot, F. J., van Wee, B. and Tillema, T. (2021). Perceived accessibility: what it is and why it differs from calculated accessibility measures based on spatial data. Journal of Transport Geography, 94, 103090. DOI: http://doi.org/10.1016/j.jtrangeo.2021.103090
82 Reyer, M. (2017). Gebaute Umwelt und Alltagsaktivität: Walkability als Chance und Risiko für das Gehen Älterer im Alltag. Stuttgart.
83 Reyer, M., Fina, S., Siedentop, S. and Schlicht, W. (2014). Walkability is only part of the story: walking for transportation in Stuttgart, Germany. International Journal of Environmental Research and Public Health, 11(6), 5849–5865. DOI: http://doi.org/10.3390/ijerph110605849
84 Root, E. D., Silbernagel, K. and Litt, J. S. (2017). Unpacking healthy landscapes: empirical assessment of neighbourhood aesthetic ratings in an urban setting. Landscape and Urban Planning, 168, 38–47. DOI: http://doi.org/10.1016/j.landurbplan.2017.09.028
85 Ruiz-Padillo, A., Pasqual, F. M., Larranaga Uriarte, A. M. and Cybis, H. B. B. (2018). Application of multi-criteria decision analysis methods for assessing walkability: a case study in Porto Alegre, Brazil. Transp. Res. Part D Transp. Environ., 63, 855–871. DOI: http://doi.org/10.1016/j.trd.2018.07.016
86 Saelens, B. E., Sallis, J. F., Black, J. B. and Chen, D. (2003). Neighborhood-based differences in physical activity: an environment scale evaluation. Am. J. Public Health, 93, 1552–1558. DOI: http://doi.org/10.2105/AJPH.93.9.1552
87 Sallis, J. F., Kerr, J., Carlson, J. A., Norman, G. J., Saelens, B. E., Durant, N. and Ainsworth, E. (2010). Evaluating a brief self-report measure of neighborhood environments for physical activity research and surveillance: Physical Activity Neighborhood Environment Scale (PANES). Journal of Physical Activity and Health, 7(4), 533–540. DOI: http://doi.org/10.1123/jpah.7.4.533
88 Sallis, J. F., Linton, L. and Kraft, M. K. (2005). The first active living research conference: growth of a transdisciplinary field. Am. J. Prev. Med., 28(2), 93–95. DOI: http://doi.org/10.1016/j.amepre.2004.10.032
89 Sarkar, S. (1993). Determination of service levels for pedestrians, with European examples. Transportation Research Record, 1405, 35–42.
90 Scheiner, J. (2013). Wohnstandortwahl und Verkehrshandeln im Kontext von Individualisierung und strukturellen Zwängen. Schwedes, O. (Ed.), Räumliche Mobilität in der zweiten Moderne. LIT Verlag, Berlin, 137–154.
91 Sen, A. (1999). Development as freedom. Oxford press. New York.
92 Solbraa, A. K., Anderssen, S. A., Holme, I. M., Kolle, E., Hansen, B. H. and Ashe, M. C. (2018). The built environment correlates of objectively measured physical activity in Norwegian adults: a cross-sectional study. Journal of Sport and Health Science, 7(1), 19–26. DOI: http://doi.org/10.1016/j.jshs.2017.11.002
93 Southworth, M. (2005). Designing the walkable city. Journal of Urban Planning and Development, 131(4), 246–257. DOI: http://doi.org/10.1061/(ASCE)0733-9488(2005)131:4(246)
94 Stals, S., Smyth, M. and Ijsselsteijn, W. (2014). Walking & talking: probing the urban lived experience. Roto, V. and. Häkkilä, J. (Eds.), Proceedings of the NordCHI ‘14. The 8th Nordic Conference on Human-Computer Interaction: Fun, Fast, Foundational. October 26–30th, 2014, Helsinki, Finland, 737–746. DOI: http://doi.org/10.1145/2639189.2641215
95 Su, S., Pi, J., Xie, H., Cai, Z. and Weng, M. (2017). Community deprivation, walkability, and public health: highlighting the social inequalities in land use planning for health promotion. Land Use Policy, 67, 315–326. DOI: http://doi.org/10.1016/j.landusepol.2017.06.005
96 Suarez-Balcazar, Y., Early, A. R., Garcia, C., Balcazar, D., Arias, D. L. and Morales, M. (2020). Walkability safety and walkability participation: a health concern. Health Education & Behavior, 47(3), 430–438. DOI: http://doi.org/10.1177/1090198120903256
97 Thielman, J., Rosella, L., Copes, R., Lebenbaum, M. and Manson, H. (2015). Neighborhood walkability: differential associations with self-reported transport walking and leisure-time physical activity in Canadian towns and cities of all sizes. Preventive Medicine, 77, 174–180. DOI: http://doi.org/10.1016/j.ypmed.2015.05.011
98 Tuckel, P. and Milczarski, W. (2015). Walk ScoreTM, perceived neighborhood walkability, and walking in the US. American Journal of Health Behavior, 39(2), 242–256. DOI: http://doi.org/10.5993/AJHB.39.2.11
99 Vale, D. S. and Pereira, M. (2017). The influence of the impedance function on gravity-based pedestrian accessibility measures: a comparative analysis. Environment and Planning B: Urban Analytics and City Science, 44(4), 740–763. DOI: http://doi.org/10.1177/0265813516641685
100 Vale, D. S., Saraiva, M. and Pereira, M. (2016). Active accessibility: a review of operational measures of walking and cycling accessibility. J. Transp. Land Use, 9(1), 209–235. DOI: http://doi.org/10.5198/jtlu.2015.593
101 Van Acker, V., Mokhtarian, P. L. and Witlox, F. (2011). Going soft: on how subjective variables explain modal choices for leisure. European Journal of Transport and Infrastructure Research, 11(2), 115–146. DOI: http://doi.org/10.18757/EJTIR.2011.11.2.2919
102 Van Cauwenberg, J., Van Holle, V., De Bourdeaudhuij, I., Van Dyck, D. and Deforche, B. (2016). Neighborhood walkability and health outcomes among older adults: the mediating role of physical activity. Health & Place, 37, 16–25. DOI: http://doi.org/10.1016/j.healthplace.2015.11.003
103 Van der Vlugt, A.-L., Curl, A. and Wittowsky, D. (2019). What about the people? Developing measures of perceived accessibility from case studies in Germany and the UK. Applied Mobilities, 4(2), 142–162. DOI: http://doi.org/10.1080/23800127.2019.1573450
104 Van der Vlugt, A.-L., Curl, A. and Scheiner, J. (2022). The influence of travel attitudes on perceived walking accessibility and walking behaviour. Travel Behaviour and Society, 27, 47–56. DOI: http://doi.org/10.1016/j.tbs.2021.11.002
105 Van der Vlugt, A.-L. and Welsch, J. (2020). Gut zu Fuß in Sennestadt? Ergebnisse der Vulnerabilitätsanalyse. Dortmund.
106 Van Dyck, D., De Meester, F., Cardon, G., Deforche, B. and De Bourdeaudhuij, I. (2013). Physical environmental attributes and active transportation in Belgium: what about adults and adolescents living in the same neighborhoods? American Journal of Health Promotion, 27(5), 330–338. DOI: http://doi.org/10.4278/ajhp.120316-QUAN-146
107 Van Holle, V., Deforche, B., Van Cauwenberg, J., Goubert, L., Maes, L., Van de Weghe, N. and De Bourdeauhuij, I. (2012). Relationship between the physical environment and different domains of physical activity in European adults: a systematic review. BMC Public Health, 12, 807. DOI: http://doi.org/10.1186/1471-2458-12-807
108 Walk Score®. (2011). Walk Score methodology. Available from http://www.walkscore.com/methodology.shtm [Accessed 1 August 2022].
109 Warner, M. E. and Zhang, X. (2019). Planning communities for all ages. Journal of Planning Education and Research, 42(4), 554–567. DOI: http://doi.org/10.1177/0739456X19828058
110 Wennberg, H., Phillips, J. and Stahl, A. (2018). How older people as pedestrians perceive the outdoor environment–methodological issues derived from studies in two European countries. Ageing & Society, 38, 2435–2467. DOI: http://doi.org/10.1017/S0144686X17000666
111 World Health Organization (WHO). (2002). Physical inactivity a leading cause of disease and disability, warns WHO. Available from https://www.who.int/news/item/04-04-2002-physical-inactivity-a-leading-cause-of-disease-and-disability-warns-who [Accessed 20 April 2022].
112 World Health Organization (WHO). (2010). Noise. Available from https://www.who.int/europe/news-room/fact-sheets/item/noise [Accessed 20 April 2022].
113 Zeng, F. and Shen, Z. J. (2020). Study on the impact of historic district built environment and its influence on residents’ walking trips: a case study of Zhangzhou ancient city’s historic district. International Journal of Environmental Research and Public Health, 17(12), 4367. DOI: http://doi.org/10.3390/ijerph17124367
114 Zuniga-Teran, A. A., Orr, B. J., Gimblett, R. H., Chalfoun, N. V., Guertin, D. P. and Marsh, S. E. (2017). Neighborhood design, physical activity, and wellbeing: Applying the walkability model. Int. J. Environ. Res. Public Health, 14(1), 76. DOI: http://doi.org/10.3390/ijerph14010076