Introduction
Bicycle parking is a critical part of the city cycling experience (Gamman, Thorpe and Willcocks, 2004; Aldred and Jungnickel, 2013). Sufficient and well-designed parking for bicycles is essential for convenient and stress-free bicycling (Larsen, 2017). Inadequate bicycle parking may damage bicycles, increase vulnerability to bike theft, exclude certain bike users, and ultimately, serve as a deterrent to riding a bike (Van der Spek and Scheltema, 2015; Buehler, Heinen and Nakamura, 2021). As cities roll-out new cycling infrastructure, more attention needs to be devoted to the placement, design, and use of bicycle parking. Past practices or designs may no longer meet the contemporary demands, requiring innovation in bicycle parking management.
And yet, research and data on bicycle parking remains scarce. We know much more about motor vehicle parking, their placement, regulation, and pricing (Shoup, Yuan and Jiang, 2017). While cities have developed sophisticated parking policies and management plans for motor vehicles, few have comparable strategies to manage bicycle parking. In most cities, bicycle parking is not even monitored. Researchers can support the city managers by monitoring bicycle parking and deciphering the basics of bicycle parking behavior, bicycle theft, and the who, how, and when bike parking is used. A renewed focus on bicycle parking is necessary to promote active transportation, healthier living and carbon-free mobility.
This study investigates patterns in on-street bike parking occupancy, use, duration times, and rotation in the city of Barcelona, Spain. We begin by examining total occupancy by neighborhood and bicycle type (private, bike-share, childrens, abandoned), thereby identifying sites with high demand and characterizing the types of bikes parked across the city. We then explore the temporal patterns in bike parking behavior over the morning, day and evening. We examine duration times, rotation and turnover to examine if high occupancy is the result of short-term parking, long-term parking or abandoned bikes. A site dominated by day users would be fundamentally different from a site dominated by long-term users. Such distinction can reveal the extent to which bicycle owners have limited access to off-street bike parking. We hypothesize that much of Barcelona’s street parking is used for long term users and bike storage, especially in the neighborhoods with high occupancy. We also hypothesize notable daily fluctuations in occupancy. Characterizing on-street bicycle parking patterns should help city planners identify priority areas for siting new bicycle parking infrastructure and in developing a bicycle parking strategy.
Literature review
City planners distinguish two types of bicycle parking infrastructure: on-street public parking and off-street parking found in private residential buildings, office buildings, or parking garages. Progressive cycling cities such as Portland (US), Vancouver (Canada), or Copenhagen (Denmark) have minimum parking requirements for off-street parking in new construction (Bell, 2015). Building regulations in the Netherlands have required space for bicycle storage since 2012 (Buehler, Heinen and Nakamura, 2021). And the European Union has recently moved to require at least two bike parking spaces for every residential unit in new and renovated buildings as part of the Energy Performance of Buildings Directive (EPBD) (Delrive, 2021). So, while regulations to manage parking in buildings and residential units is more mature, on-street public parking is subject to less study and regulation and more ad-hoc placement. The focus of this study is on public on-street parking.
Most cities design on-street bike parking for day use or short-term visits. However, in practice, these spots may be used for overnight parking or long-term storage. When homes are too small or residents live on upper floors without elevators, they may store their bikes on city streets. City bike racks also accumulate abandoned bikes, damaged bikes, or stripped bikes. And in some cities, dockless shared bicycles and scooters are beginning to clutter on-street parking sites. As on-street bike parking fills up, it becomes more difficult for users to find spots and may push cyclists to park informally on-street furniture, poles, or railings. Informal bike parking can obstruct pedestrian movement and foster the perception of urban disorder. Understanding the diversity of users of on-street bicycle parking and its temporal dynamics may assist in the management of this mobility infrastructure.
Many cities have set ambitious goals to increase the modal share of cyclists given the health and environmental benefits associated with this form of active travel. Therefore, we should expect an increase in the demand for on-street bicycle parking. City managers in low-cycling cities can prepare in this regard by increasing bike storage capacity and learning from places where cycling is more common. Cities and towns in Denmark and the Netherlands have confronted serious capacity problems in on-street bicycle parking, especially at transit stations, universities and downtown destinations (Van der Spek and Scheltema, 2015; Jonkeren and Kager, 2021). The cities of Delft, The Hague, and Copenhagen frequently have on-street bike parking at full capacity. Some sites have huge swings in demand, rapidly shifting from nearly empty to over capacity during peak demand (Van der Spek and Scheltema, 2015). The bicycle parking problem has become so severe in transit stations in the Netherlands, that the Dutch National Railway system has turned to shared bicycles as a strategy to relieve stations from parking pressures (Jonkeren and Kager, 2021).
Bicycle parking has been studied most extensively at public transit locations given its potential to increase demand for both public transit and cycling (Heinen and Buehler, 2019). In a survey of bicycle parking at train stations in New Jersey, researchers found that bike parking was full at six of the 214 stations studied, and three had more than 50% of bicycle parking occupied by abandoned bikes (Harvey et al., 2016). Similarly, scholars have studied bicycle parking patterns at train stations in Australia (Arbis et al., 2016). Others have examined bicycle parking facilities at work destinations. The creation of bike parking facilities is associated with an increase in bike parking to work. Using logistic regression of travel survey data from Washington, DC, research has found that workers are more likely to cycle to work when they have access to bicycle parking and showers at their office destination (Buehler, 2012).
Research on bicycle parking is also closely linked to the built environment and urban design conditions that may increase the risk of bike theft. A study using data from Seattle, Washington finds that bicycle theft is correlated with higher density areas, places with a high concentration of human activity, greater commercial and mixed land use, and more sidewalks, bike lanes, and bike racks (Chen, Liu and Sun, 2018). More recently, scholars have also conducted bicycle parking ethnographies that compare bicycle parking practices in New York City with Copenhagen (Larsen, 2017). Others have modelled the determinants of bicycle parking demand (van Kampen et al., 2021) or explored the design, placement and physical configurations of bicycle parking (Napper, 2020). Napper (2020), for example, examines the geometry of bicycles, based on bicycle length, handlebar height and width, identifying mismatches between the geometry of the bicycles and the design of the parking infrastructure.
Studies on bicycle parking occupancy over time are scarce. Moskovitz and Wheeler (2011) analyze parking patterns over a 12-hour period on the campus of Portland State University using time series photography, and document clear patterns in which occupancy increases during the day and then recedes in the evening. Buehler et al. (2021) review the bicycle parking conditions and capacity in 11 bike friendly cities (Buehler, Heinen and Nakamura, 2021). They highlight that Washington, DC reports 3,000 parking spots on city streets with additional spots on Metrorail stations. Minneapolis reports 20,000 spots in 4,500 racks and explicitly allows bicycle parking at all signposts. Kyoto reports 35,000 public bike parking spots and 10,000 private spots. In Berlin there are 26,000 parking places at U-Bahn and S-Bhan stations, with the goal of building 100,000 more parking spaces by 2025. London is currently developing a bicycle parking strategy, but total capacity is unclear. And the Tokyo prefecture has an astounding 920,000 bicycle parking spots of which 50% are operated by ward offices and 50% are private. Finally, Paris, which has recently positioned itself as an emerging cycling city, has ambitious plans to add 130,000 new bike parking spots by 2026 (City of Paris, 2021).
Despite this review, there is no known city-wide analysis of bike parking patterns in any city or city-wide study on temporal variation, cycle types, rotation rates, or turnover (Heinen and Buehler, 2019). This is the gap we aim to fill by specifically asking: what are the occupancy levels of on-street bicycle parking in Barcelona? What types of bicycles do we observe parked on the streets and do they vary by neighborhood? How long are the bicycles parked at each location, and do we observe fluctuations in total use of bicycle parking facilities over the course of the day?
Method
Cycling infrastructure in Barcelona
Investments in cycling infrastructure and bike parking has supported an emerging cycling culture in Barcelona. The city went from 20 km to 110 km of bike lanes from 1992–2000. Since 2015, the kilometers of separated bike lanes have doubled, creating a network of 240 km which will increase by 33 km in 2023 (Magrinyà, 2021). Every year more residents are using a bike to get around the city. Barcelona has one of the world’s most successful bike-sharing programs and tourists use private, dockless shared bikes to move around and explore. Furthermore, the cycling community is active and energized, creating the sense that there is momentum behind the cycling agenda in the city.
At the same time, travel surveys in Barcelona report that less than 3% of trips are made by bicycle (ATM, 2022). This is low if compared to the Netherlands, Germany, Denmark, or other northern European countries with cycling rates over 30%. Problems of saturated bicycle parking and bike theft continue to be barriers for citizens to take up cycling. While the city is interested in investing in more bicycle infrastructure, there is limited data on who, how and when bike parking infrastructure is used.
Bike parking infrastructure has grown dramatically in the last two decades (Figure 1). Official data from the city shows that the number of bike parking has grown by a factor of 38, from 1,100 sites in 2001 to 38,930 in 2022 (City of Barcelona, 2022).
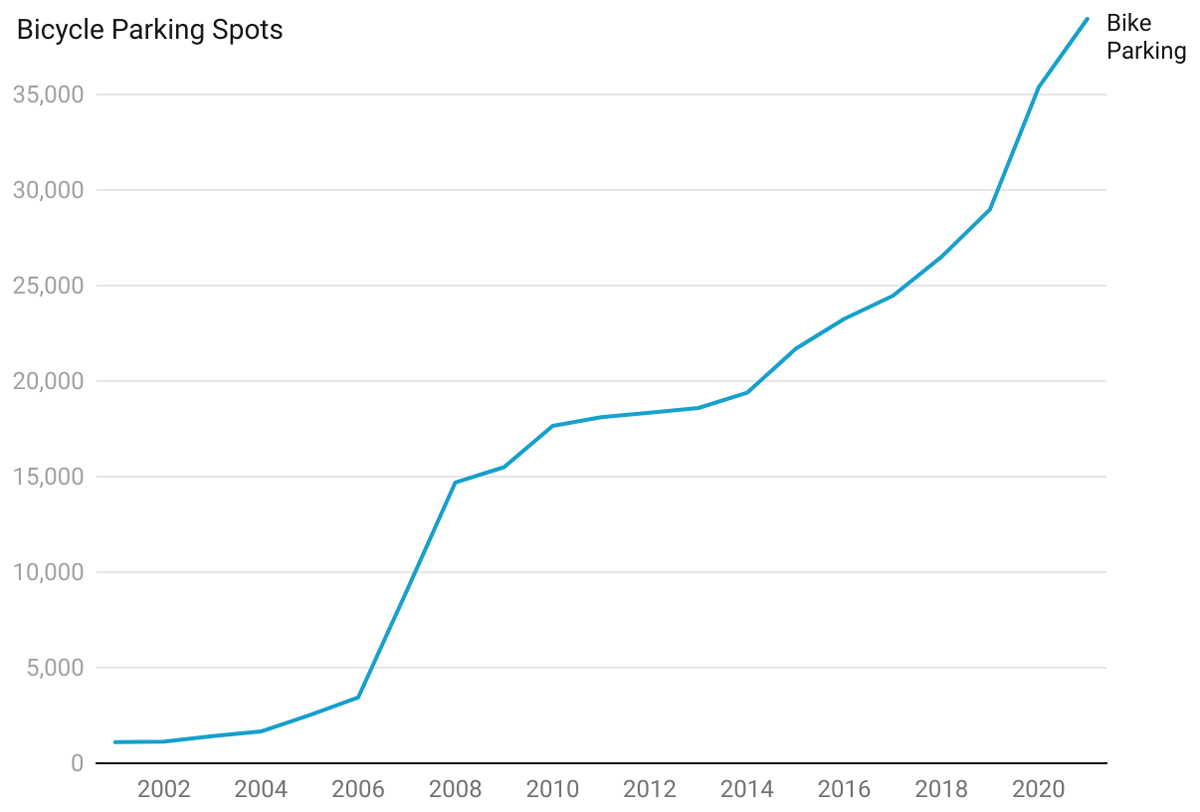
Growth in on-street bike parking in Barcelona. Data source: City of Barcelona.
Data collection and analysis
To examine the use patterns, occupancy, and rotation rates of on-street bike parking in Barcelona, we sampled each of Barcelona’s ten districts with rectangular plots of 20 ha in size (approximately eight city blocks). To locate our ten sample plots, we selected the centroid of the historical neighborhood of each district. All parking locations that fell within our sample plot became part of our study. The 163 sampled locations represent 5% of the total on-street parking locations in the city and provide parking for 1,916 bicycles. We organized two data collection campaigns, one in spring 2021 (March-April), and another in summer 2021 (June–July).
The spring campaign measured occupancy and bicycle type twice a day: at midday (12:00 to 15:00 hrs) and in the evening (19:00 to 22:00 hrs). We chose to observe day and evening times because we hypothesized higher occupancy during the daytime, as a result of a greater movement of bicycles during the day and occupancy from short term users who store their bicycles at home overnight.
We used the phone app KoBo Collect to collect field observations. This allowed co-authors to contribute data to the same cloud-database, at all sites, simultaneously. At each parking site we collected total capacity, the number of parked private bikes, children bikes, shared bikes, abandoned bikes, or bike parts and scooters. The private bike category included all types of bikes that were privately owned (electric, foldable, cargo, etc). The shared bikes included bikes from all four dockless bicycle companies that operate in Barcelona, but not from Barcelona’s Bicing bike-share system because these have docking stations that were not included in our study. The shared bikes tended to be located adjacent to the parking locations and were counted if they were within two meters of the site. The category ‘abandoned bikes/bike parts’ included all bikes with obvious signs that it had not been moved in months. Twisted tires, vandalized bikes, or flat tires were indicators of abandoned bikes. This category also included stripped bikes, bike frames, or solitary tires. We did not count abandoned locks or the presence of child seats on bikes. The spring campaign resulted in 657 observations over 22 days and counted 4,153 bikes in total. Each site was counted four times during the spring field campaign.
Rotation and turnover
The summer campaign intensified the frequency of our measurement at each location with the aim of identifying rotation rates and duration times. We estimated rotation and turnover by repeating visits to the same parking facility five times per day. On each visit, we marked the parked bicycles with a color sticker that we placed on the tire to denote the time the bicycle was first identified at that location. Stickers were placed every three hours starting at 9:00 hrs (white sticker), 12:00 hrs (blue), 15:00 hrs (green), 18:00 hrs (yellow) and 21:00 hrs (red). We repeated this measurement for two days. On day two, we used the same color stickers but added a “2” to distinguish the sticker-marker. This method allowed us to know the approximate day and time that each bike was parked at that location. We then re-visited the parking locations in a “check-in” visit approximately one week later to identify long term stays. If the bicycle moved, the sticker would fall off or be visibly damaged or dirtied, allowing us to know that the bicycle had moved locations. Bike parking sites were therefore visited a total of ten times in two days and revisited one time 7–10 days later. Data were once again collected in KoBo Collect as in our previous campaign.
In neighborhoods with a considerable number of bike parking locations (20+), we were unable to sample the entire plot in the time allowed. Recall that our sampling frequency in the summer campaign was very intense, with samples every three hours. Therefore, in neighborhoods with more than 20 parking locations, we sampled half of the original sites on “day 1” and the other half on “day 2”. The summer field campaign resulted in 1,197 observations and counted 7,382 bicycles. The total number of observations when combining both spring and summer campaigns was 1,854 observations and 11,535 bicycles counted.
City-wide estimates
To estimate the total number of bicycles parked on the streets of Barcelona we first extrapolate from our sample to the district level. We assume that the district sample is representative of patterns in that same district, and then produce a city-wide estimate of the total number of bicycles and type found throughout the city.
Data cleaning
We aimed to sample the exact same sites in both field campaigns but there were instances in which sample sites did not overlap. There exist a small number of sites that were only sampled in one campaign or the other. At one site we observed that the stickers were being systematically removed and therefore we stopped collecting data there.
Results
Bicycle type
We estimate that Barcelona has approximately 18,730 bicycles parked on the street every day. Our estimate only includes bicycles parked on the street and not bicycles parked in homes, storage locations, or underground parking. Most bicycles (83%) were categorized as private bikes, while 8% were dockless shared bikes, and 5% were children’s. We estimate that 3% of all parked bikes are abandoned, occupying 1% of all bike rack locations. Virtually no scooters were found. To contextualize the total number of bicycles on city streets, Barcelona has 822,211 registered motor vehicles (City of Barcelona, 2020), while cities such as Amsterdam and Copenhagen report 847,000 and 265,700 bicycles respectively (Vetter and Honey-Rosés, 2022). We find that bicycles are unevenly distributed throughout the city, with the district of Gràcia having ten times more bicycles than the districts with fewer bicycles. In contrast, the number of shared bicycles, children bicycles, and abandoned bicycles are more evenly distributed across neighborhoods (Figure 2).
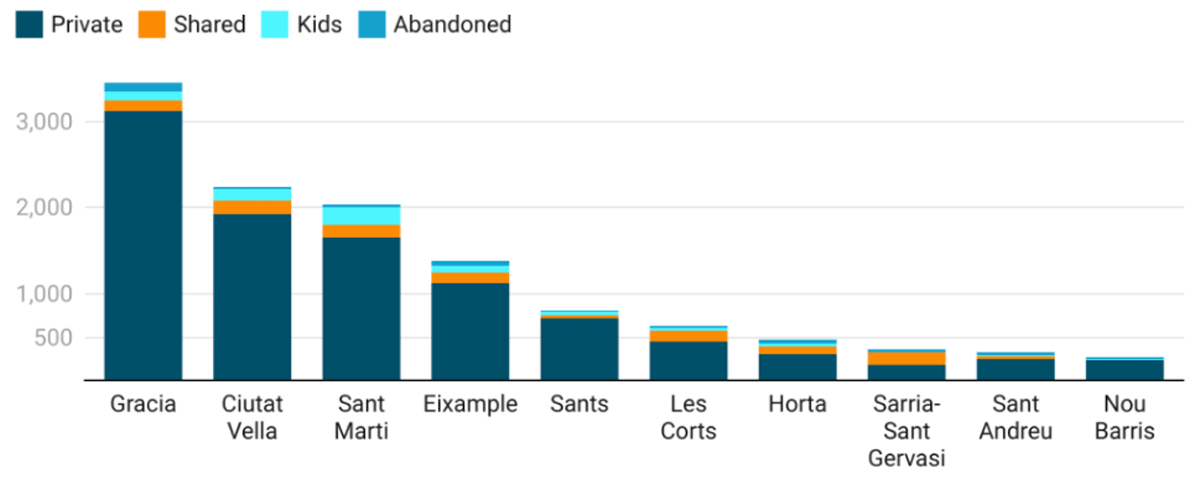
The total and proportion of bikes parked in on-street locations in the ten districts of Barcelona.
Occupancy
Saturated bicycle parking is not uncommon. We find that 10% of bike parking locations were saturated and 30% reached saturation in at least one measurement. We define parking saturation as a site with the average occupancy above 90%. If we classify the bike parking locations by high use (70–89%) or saturated (90%+), healthy use (30–69%) and low use (<29%), we find that parking facilities are distributed into one-third each (Figure 3). The neighborhoods of Gràcia and the Old City (Ciutat Vella) have the highest occupancy rates of bike parking facilities, with an average occupancy across all locations of 82% and 76% respectively (Figure 4). The districts of Sant Martí, Sants de Montjuïc, Horta-Guinardo, and Eixample show a relatively high bike parking occupancy of between 40% and 70%. The districts with higher bike parking occupancy are located centrally in Barcelona and along the waterfront. The districts with lower occupancy are located on the perimeter of the city, at higher elevations and further away from the waterfront. In neighborhoods with low occupancy, we found only three of 163 (1.8%) parking locations with no bicycles in any observation.
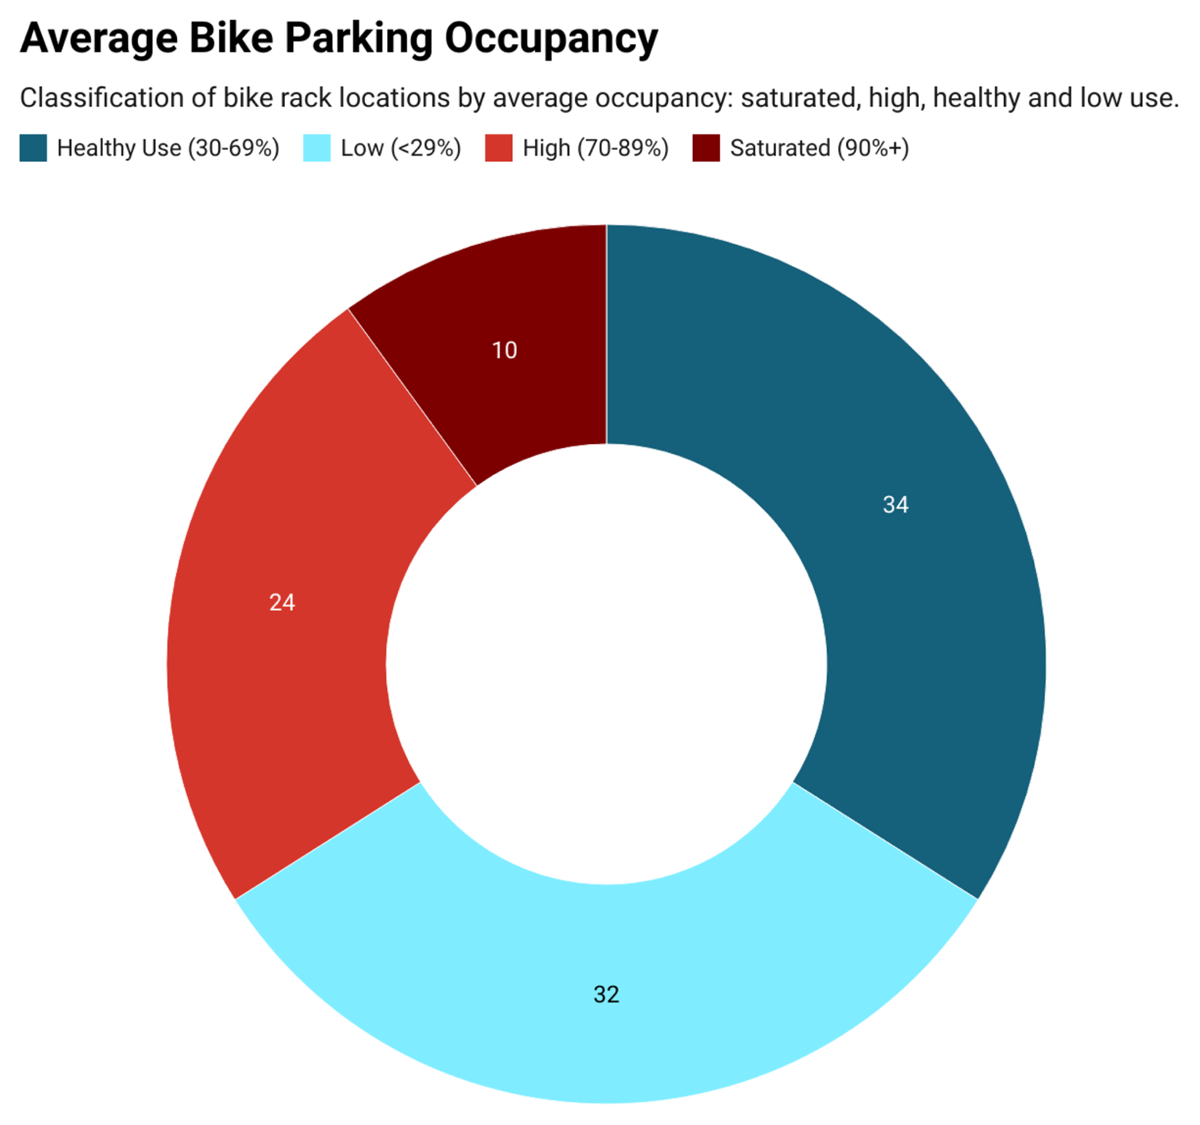
Average bicycle parking occupancy. Classification of bike parking locations by average occupancy: saturated, high, healthy use, and low occupancy.
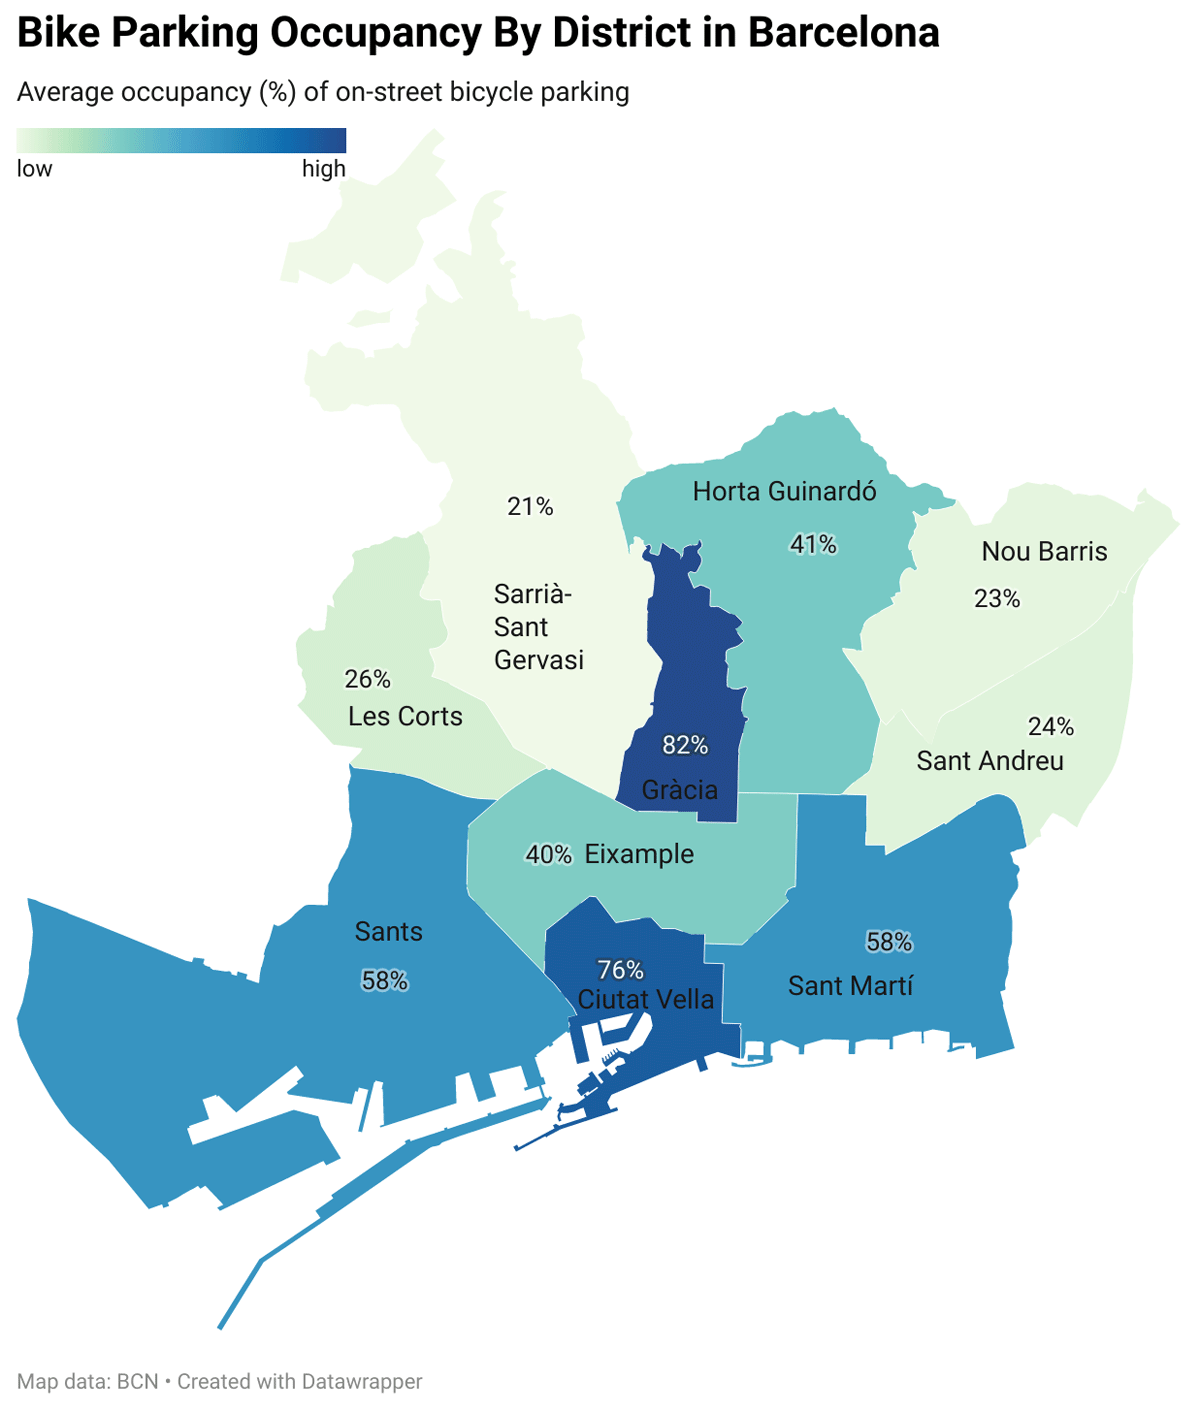
Occupancy of on-street bike parking in Barcelona by district.
Occupancy and capacity
We explored the relationship between occupancy and capacity to see if the saturated sites are the result of very small parking locations, or conversely, the low occupancy is simply the product of parking locations with many spots. We observe that occupancy rates are high across the entire range of capacity. This tells us that the high occupancy is not the result of very small parking locations (4–6 spots), and we see high demand for parking across all capacity levels. Even sites that are large (24+) still have high occupancy, suggesting to us that supply is being added to areas with high demand.
Daily patterns
We were also interested in learning about daily patterns and fluctuation. Contrary to our hypothesis, we do not find clear daily patterns, and observe that occupancy rates are highly stable over all hours of the day and evening (Figure 5). We expected to see more parked bicycles during the daytime hours, and fewer parked bicycles in the evening, with a clear and legible diurnal pattern as found with pedestrian movement (Akaltin et al., 2019), and documented in other work on bicycle parking (Moskovitz and Wheeler, 2011). Instead, occupancy levels are stable across the day, and this stability is consistent in all neighborhoods. We are unable to see the impact of bicycles coming out of people’s homes and into the streets as we had hypothesized. Instead, those who store their bicycles at home do not appear to park their bike on city streets in large numbers, presumably because of fear of theft (Vetter and Honey-Rosés, 2022). This stability in the occupancy rates also suggests that the duration times at each location are longer than a day, since large fluctuations would be visible if most users were short-term day users. Future sampling would thus benefit from a research design that would sample over a greater spatial extent rather than repeated sampling over a day, unless the objective is to understand duration times and rotation rates specifically.
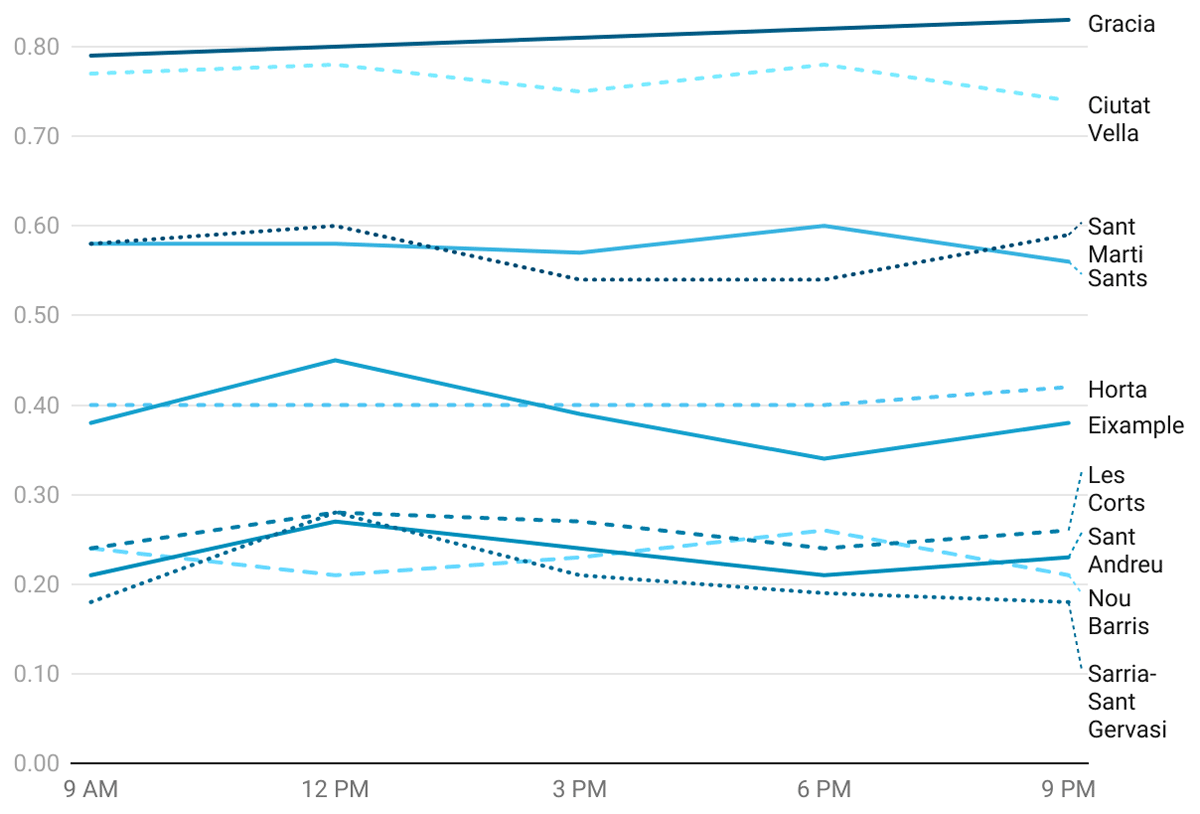
Daily patterns in bike parking occupancy in each district over the morning, day and early evening. Contrary to our hypothesis, we do not see a rise in occupancy during the day. Instead, we observe highly stable occupancy levels in all districts.
Duration
Repeated measurements at the same locations allowed us to estimate how long bicycles stayed at each location. We find that only 12% of bikes stayed for 3–10 hours (day-use), while 53% of bikes were parked for an extended period (i.e., more than a day, but less than a week). Finally, 35% of bicycles in Barcelona did not move for more than a week, indicating a significant proportion of long-term use or storage. In short, few users are parking their bike for day use, most park for more than a day but less than a week, and long-term use is approximately one-third of parked bicycles. The small number of short-term day users is consistent with the stable daily pattern mentioned earlier and re-enforces the idea that when a bicycle is parked on the streets, it is likely to be parked for more than a day.
Rotation and turnover
Rotation and turnover are measures of how many bicycles move through a location on a particular day. The rate at which bicycles arrive and leave a location can be visualized for each site where there are repeated measurements (Figure 6). The bicycles parked for the long-term remain, while new bicycles arrive as spots become available. Moskovitz and Wheeler (2011) define turnover as “the ratio of volume to capacity,” in which volume is “the total number of unique instances of a bicycle parked at a facility,” or the total number of bicycles that have moved through the site in a day. As more bicycles move through a parking location, turnover increases. The notion of turnover is important because it indicates the level of service that a particular location provides to the cycling community. In some respects, turnover is a better indicator of parking demand than occupancy, because locations with high turnover provide real parking services to bicycle users. Locations that have full occupancy, yet little rotation, are unable to provide parking service to users in practice. In contrast, locations with high turnover and rotation are more likely to free spaces for users to park. Merely identifying occupancy levels without considering rotation or turnover, may mislead city officials in identifying locations with the greatest demand and use.
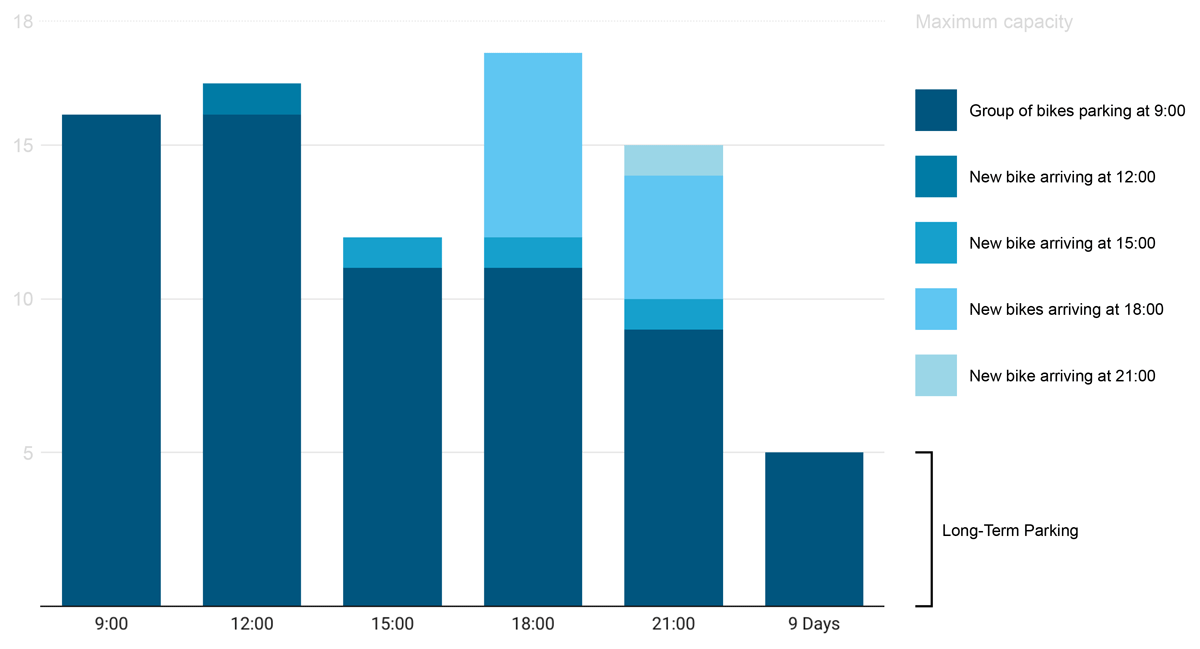
The arrival and departure of bicycles at a particular site illustrates how bike parking sites may serve more bicycles over a day than total spots available. In this example, we observe new bicycles arrive and depart every three hours. After nine days, we found five of the original 16 bicycles remained at the site.
The challenge is that without repeated measurements at the same location, it is impossible to identify the turnover of a particular site. By observing occupancy alone, it may appear that two sites are similar, but the underlying dynamic may be vastly different. For instance, two locations with 90% occupancy may provide a different level of service if one has higher rotation and turnover, while the other has none. In short, examining locations with high turnover identifies where the city infrastructure is providing the most service, and these sites may or may not have the highest occupancy levels.
Locations with turnover greater than 1.0 indicate that more bicycles are serviced in a day than the number of spaces available at that location. We find that 32 of 153 parking locations (23%) had a service index of 1.0 or greater. When plotting average occupancy with turnover, one can appreciate that there are several locations that provide service to more bicycles than spots available (turnover >1) even though the average occupancy is below 100% (Figure 7).
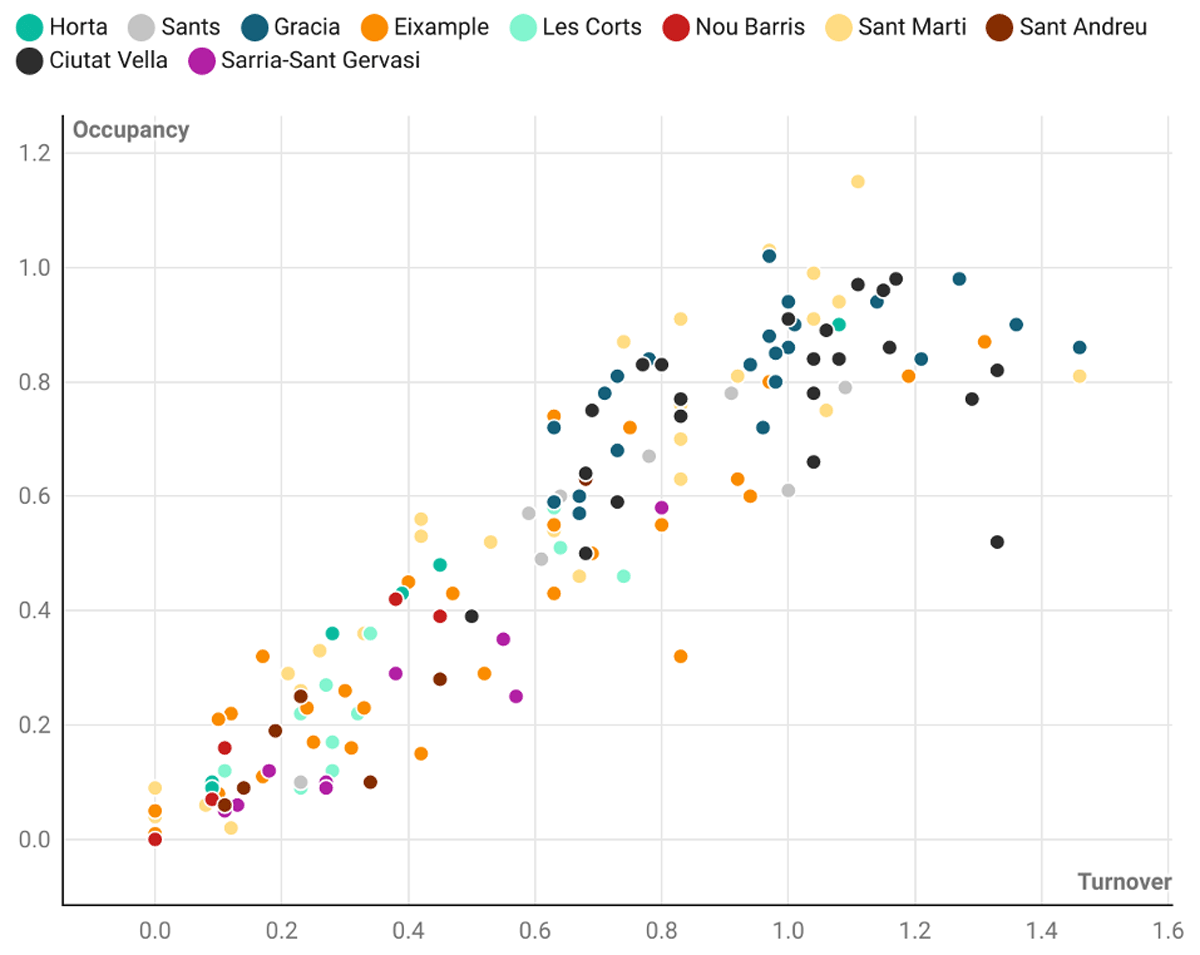
Scatter plot of occupancy and turnover. Sites with occupancy above 1.0 implies that on average, they were over 100% occupied. Sites with turnover above 1.0 implies that this site served more bicycles than spots available in that day.
Conclusion
Bike parking remains largely an afterthought in urban planning and design, and it is largely unexplored territory with a long list of unanswered research questions. And yet to build the healthy and sustainable cities of the future, bike parking will need more serious attention because improved cycling infrastructure can facilitate healthier living, a low-carbon lifestyle, and active travel choices (Buehler and Pucher, 2021).
To our knowledge, we have provided the first city-wide study on occupancy, duration, long term parking, service-levels and turnover in the bicycle parking literature. We have found that in most parts of the city, cyclists should be able to find on-street bike parking near their destination. Yet there are exceptions, and, in some neighborhoods, on-street bicycle parking is scarce, and the demand exceeds supply. Insufficient bicycle parking is likely to contribute to informal parking on city furniture. Furthermore, we would suggest that the persistent saturation of bicycle parking may frustrate cyclists and contribute to the perception that bicycle parking is under supplied. Saturated bike parking and informal parking outside of designated areas can contribute to a sense of urban disorder, both for cyclists and non-cyclists alike. Inadequate management of abandoned bicycles and long-term storage can create problems and conflicts for day users, which then ripple out across the city.
Our work provides valuable information for city planners in Barcelona. The identification of saturated bicycle parking locations should inform decisions about where new bicycle parking locations are needed. We also provide essential data on bike parking demand, needs, bike type and total volume, which is essential data for creating a city-wide bicycle parking strategy. Our findings may also be used to inform city licensing policy with bike share service providers, to determine appropriate prices and volumes that are proportional to the burden generated on other bicycle users and in proportion to their use of public space at highly visited sites. Understanding where there are abandoned bikes should also facilitate the strategic monitoring and removal of such bikes by city staff. And finally, we provide data to improve our estimates of exposure risk of bicycle theft.
For our study, one might be concerned about how pandemic related restrictions may have influenced field observations. Our field work in spring and summer 2021 took place when there were travel restrictions making it difficult, but not impossible to cross international borders. Spain made an effort to attract international tourism already in 2021, although we admit that the total numbers of international visitors were lower than in pre-COVID-19 years. Therefore, the pandemic may have influenced our field observations in a few ways. It is conceivable that fear of using public transportation may have motivated some to use a bicycle and this shift could have increased the bicycle parking occupancy and rotation observed. In contrast, the lower number of international visitors probably reduced the number of shared dockless bicycles in circulation. Overall, it is difficult to determine with precision how the pandemic may have changed bicycle parking behaviour and patterns of bike flows in the city and we thus encourage future research to explore if our observed occupation and rotational patters still hold true.
We also acknowledge that our study simply offers one data point for a low-cycling European city that is making progress in its cycling agenda. Are the stable occupancy levels observed in Barcelona similar in other cities and regions? To what extent do other large cities have problems with abandoned bikes or long-term parking? There are also questions about who is parking on city streets (private, children, cargo, or abandoned bikes,) and how the bicycle type mix might vary across cities. More research could thus investigate the extent to which private-bike share companies occupy large proportions of the public parking spaces. It could also analyze the effect of informal bicycle parking on city infrastructure and the extent to which this issue generates mobility barriers.
There are also questions about bike parking behavior to be explored, e.g., are spatial patterns of saturation on-street bike parking related to land uses, destinations, or housing density? What do patterns about on-street bike parking reveal about habits, expectations, and needs? And what is the relationship between demand for on-street parking with off-street parking? It seems like bike owners prefer to congregate their bikes in sites that are already used, as if there were safety in numbers, protecting their bicycle from theft. Can this idea be corroborated with qualitative research? It is also well known that expensive bikes are rarely parked on the street, but what is the cost threshold for most users at which they are willing to leave it on the street?
There are also practical questions of interest to city managers. How can we identify locations where bike parking is scarce and where the storage capacity needs to be improved? The cycling community will often push for improved and higher quality bicycle parking infrastructure, but it is unclear what the appropriate on-street solution should be. Should cities provide protective structures to protect bicycles instead of on-street anchorage sites? Protected structures require a physical infrastructure, a pricing system, security systems and an institution to be responsible, with legal implications. How can cities decide if they should invest in secure and safe bike parking on city streets? Or should they simply re-design existing on-street parking? What might be the impact of bicycle parking design on perceptions of safety and risk of theft?
Finally, there are also methodological questions. How should we design studies that aim to estimate city-wide occupancy levels, turnover rates and service levels? Bike parking patterns are dynamic, and may vary from neighborhood to neighborhood, making the collection of data on bike parking patterns highly resource intensive. Researchers might consider enlisting support from the cycling community to crowdsource data on bike parking. A collaborative platform on bicycle parking could allow researchers to have more detailed information about what, when and where bicycles are parked in the city.
It has been said that “you cannot manage what you do not measure.” And yet few cities monitor bicycle parking patterns and use. Systematizing these data is a pending next step to advance the science of urban cycling and active travel. While the focus of this study is on public street parking, on and off-street parking are closely connected, and the presence of persistent long-term parking on-street is symptomatic of difficulties with bike parking in private spaces. Therefore, this work aims to inform on-street bike parking strategy, but also provide clues about how to design a city bike parking strategy more broadly.
Acknowledgements
This work contributes to ICTA-UAB “María de Maeztu” Programme for Units of Excellence of the Spanish Ministry of Science and Innovation (CEX2019-000940-M). J.H.R. was supported by the Ramón y Cajal Fellowship (Ministerio de Ciencia y Universidades RyC-2019-027279-I).
Competing Interests
The authors have no competing interests to declare.
Author Contributions
The authors confirm contribution to the paper. All authors participated in study conception and design; data collection; analysis and interpretation of results; and draft manuscript preparation. All authors reviewed the results and approved the final version of the manuscript.
References
1 Akaltin, D. et al. (2019). Life in Poblenou: Observing Spaces in Transition. Vancouver, Canada: University of British Columbia. School of Community and Regional Planning. (Accessed January 2021). DOI: http://doi.org/10.14288/1.0384917
2 Aldred, R. and Jungnickel, K. (2013). Matter in or out of place? Bicycle parking strategies and their effects on people, practices and places. Social & Cultural Geography, 14(6), 604–624. DOI: http://doi.org/10.1080/14649365.2013.790993
3 Arbis, D. et al. (2016). Analysis and planning of bicycle parking for public transport stations. International Journal of Sustainable Transportation, 10(6), 495–504. DOI: http://doi.org/10.1080/15568318.2015.1010668
4 ATM. (2022). Enquesta de Mobilitat en Dia Feiner (EMEF 2021). Barcelona.
5 Bell, P.J. (2015). Coming to a Stop: All Ages and Abilities Bicycle Parking in New and Existing Development. Canada: City of Vancouver.
6 Buehler, R. (2012). Determinants of bicycle commuting in the Washington, DC region: The role of bicycle parking, cyclist showers, and free car parking at work. Transportation Research Part D, Transport and Environment, 17(7), 525–531. DOI: http://doi.org/10.1016/j.trd.2012.06.003
7 Buehler, R., Heinen, E. and Nakamura, K. (2021). Bicycle Parking. In: Buehler, R. and Pucher, J. (eds.). Cycling for Sustainable Cities. Cambridge, MA: MIT Press, 103–117. DOI: http://doi.org/10.7551/mitpress/11963.003.0010
8 Buehler, R. and Pucher, J.R. (2021). Cycling for sustainable cities. Cambridge, MA: MIT Press. DOI: http://doi.org/10.7551/mitpress/11963.001.0001
9 Chen, P., Liu, Q. and Sun, F. (2018). Bicycle parking security and built environments. Transportation Research Part D: Transport and Environment, 62(March), 169–178. DOI: http://doi.org/10.1016/j.trd.2018.02.020
10 City of Barcelona. (2020). Anuari estadístic de la ciutat de Barcelona. 2020. Available from https://bcnroc.ajuntament.barcelona.cat/jspui/handle/11703/119961. (Accessed 13 January 2022)
11 City of Barcelona. (2022). Bicycle Parking. Available from https://ajuntament.barcelona.cat/bicicleta/en/services/parking [Accessed 19 July 2023].
12 City of Paris. (2021). Plan Vélo 2021–2026. Paris. URL: https://cdn.paris.fr/paris/2021/12/08/2fc9cb8ad6db58b6bfde3e6ccfc4c48c.pdf (Accessed 13 January 2022)
13 Delrive, T. (2021). EPBD: Mandatory bicycle parking in all new and renovated buildings will make cycling easier for millions of Europeans. Brussels: European Cycling Federation. URL: https://ecf.com/news-and-events/news/epbd-mandatory-bicycle-parking-all-new-and-renovated-buildings-will-make#:~:text=The%20European%20Commission’s%20revision%20proposal,easier%20for%20millions%20of%20people. (Accessed 13 January 2022)
14 Gamman, L., Thorpe, A. and Willcocks, M. (2004). Bike Off! tracking the design terrains of cycle parking: Reviewing use, misuse and abuse. Crime Prevention and Community Safety, 6(4), 19–36. DOI: http://doi.org/10.1057/palgrave.cpcs.8140199
15 Harvey, E. et al. (2016). Bicycling to Rail Stations in New Jersey. Transportation Research Record: Journal of the Transportation Research Board, 2587(1), 50–60. DOI: http://doi.org/10.3141/2587-07
16 Heinen, E. and Buehler, R. (2019). Bicycle parking: a systematic review of scientific literature on parking behaviour, parking preferences, and their influence on cycling and travel behaviour. Transport Reviews, 39(5), 630–656. DOI: http://doi.org/10.1080/01441647.2019.1590477
17 Jonkeren, O. and Kager, R. (2021). Bicycle parking at train stations in the Netherlands: Travellers’ behaviour and policy options. Research in Transportation Business and Management, 40(May 2020), 100581. DOI: http://doi.org/10.1016/j.rtbm.2020.100581
18 Larsen, J. (2017). Bicycle Parking and Locking: Ethnography of Designs and Practices. Mobilities, 12(1), 53–75. DOI: http://doi.org/10.1080/17450101.2014.993534
19 Magrinyà, F. (2021). Barcelona: un cambio de paradigma hacia una movilidad activa. In: Ruíz-Apilánez, B. E. Solís, (eds) A pie o en bici. Perspectivas y experiencias en torno a la movilidad activa. Ciudad Real: Ediciones de la Universidad de Castilla-La Mancha. 135–147 URL https://ruidera.uclm.es/xmlui/bitstream/handle/10578/28945/A%20PIE%20O%20EN%20BICI%203%20E02%20Barcelona.pdf?sequence=1&isAllowed=y.
20 Moskovitz, D. and Wheeler, N. (2011). Bicycle parking analysis with time series photography. Transportation Research Record, (2247), 64–71. DOI: http://doi.org/10.3141/2247-08
21 Napper, R. (2020). What is a parked bicycle? Vehicle fleet characteristics in Australia. Transportation Research Interdisciplinary Perspectives, 7, 100204. DOI: http://doi.org/10.1016/j.trip.2020.100204
22 Shoup, D., Yuan, Q. and Jiang, X. (2017). Charging for Parking to Finance Public Services. Journal of Planning Education and Research, 37(2), 136–149. DOI: http://doi.org/10.1177/0739456X16649416
23 Van der Spek, S.C. and Scheltema, N. (2015). The importance of bicycle parking management. Research in Transportation Business and Management, 15, 39–49. DOI: http://doi.org/10.1016/j.rtbm.2015.03.001
24 van Kampen, J. et al. (2021). Bicycle parking in station areas in the Netherlands. Procedia Computer Science, 184(2019), 338–345. DOI: http://doi.org/10.1016/j.procs.2021.03.043
25 Vetter, L. and Honey-Rosés, J. (2022). El robatori de bicis a Barcelona 2021. Barcelona: City Lab Barcelona. Institut de Ciència i Tecnologia Ambientals (ICTA-UAB) Universitat Autònoma de Barcelona URL: https://ddd.uab.cat/record/265644. (Accessed 13 September 2022).