1. Introduction
As a low-cost, low-carbon, and health-promoting mode of transport, cycling is increasingly being championed by transportation planners, decision-makers, and advocates for its wide range of individual and societal benefits. Safe and inviting bicycling infrastructure and policy can provide individuals, including those with budget constraints, a healthy and affordable way to reach desired destinations (Doran, El-Geneidy and Manaugh, 2021; Lubitow and Miller, 2013; Manaugh, Badami and El-Geneidy, 2015). It is now common for Canadian municipalities to include sections in transportation master plans, or standalone cycling plans, dedicated to planning bicycling infrastructure, policy, and programs. These plans are translating to substantial investments in bicycling infrastructure. Within just a decade, major cities and regions, such as Ottawa and Metro Vancouver, have more than doubled their bicycling networks (City of Ottawa, 2013; HUB Cycling and TransLink, 2019). This wide-scale promotion and investment in cycling in Canada has seemingly had some effect on behaviors; while the proportion of commuters who cycle has only increased from 1.3% in 1996 to 1.5% in 2016, some metropolitan areas have seen much larger increases (e.g., from 5.0% to 6.4% in Victoria and from 1.2% to 2.3% in Montréal), and some individual neighborhoods have experienced even larger increases (Statistics Canada, 1996; Statistics Canada, 2016).
1.1. Inclusive bicycling
The increased investment in cycling and growth in bicycle mode share raises important questions about who is benefitting from these investments. Researchers and practitioners are increasingly recognizing that the benefits (e.g., access to opportunities) and burdens (e.g., traffic collisions) of transportation are inequitably distributed across population groups (Pereira, Schwanen and Banister, 2017). In Canadian cities, bicycling infrastructure, including bike share stations, is less prevalent in neighborhoods with lower socioeconomic status (Fuller and Winters, 2017; Hosford and Winters, 2018). In the US, some research suggests that areas with larger white and higher-income populations are afforded better access by bicycle to destinations such as healthcare facilities and grocery stores (Jahanshahi et al., 2021). Overall, this body of work collectively underscores that there is marked variability across cities in the patterns of both existing and new investments in bicycling infrastructure by area-level income and race (Braun, Rodriguez and Gordon-Larsen, 2019; Ferenchak and Marshall, 2021; Fuller and Winters, 2017). In response, many municipalities are incorporating equity-based goals, objectives, and project prioritization procedures into their transportation plans (Doran, El-Geneidy and Manaugh, 2021; Manaugh, Badami and El-Geneidy, 2015).
There are other important influences beyond infrastructure for cities to consider when creating an inclusive cycling culture. The availability of bicycling infrastructure can increase levels of cycling and reduce the risk of traffic collisions (Pucher, Dill and Handy, 2010), but infrastructure alone does not necessarily generate a diversity in the profile of people who bicycle (Lubitow and Miller, 2013). Cycling has been perceived by people of color as “something that white people do” (Briseño et al., 2019) and the construction of bicycling infrastructure can lead to fears of gentrification and displacement by low-income and racialized residents (Lubitow and Miller, 2013). This may lead to other groups feeling unfamiliar and uncomfortable with cycling, which can be compounded by the disproportionate vulnerability to traffic collisions and to harassment by police that Black, Indigenous, and people of color (BIPOC) and low-income residents can experience in public space (Agyeman and Doran, 2021). Indeed, research shows that Black and Latino Americans are up to 30% more likely than white Americans to die while cycling (Zimmerman et al., 2015). An inclusive cycling culture is required for populations facing structural disadvantages to fully benefit from investments in bicycling infrastructure.
Concurrent with this growing empirical evidence base on differences in bicycling behaviours across population groups, there has been a proliferation of scholarship concerned with the place of bicycling in wider debates around transport equity or mobility justice (Golub, 2016; Sheller, 2020). Current work that identifies differences in bicycling across population groups tends to engage more explicitly with transport justice and identify systemic and cultural changes to promote more equitable bicycling outcomes. For example, Martens and colleagues (Martens et al., 2016) discuss the role of cycling to promote wider social goals of inclusion as well as environmental quality, while Soliz (2021) explores how social movements can be integrated into bicycle planning in underserved areas.
1.2. Evidence on demographic trends in cycling
National data from North America and Western Europe do indeed show differences in bicycling mode share across sociodemographic groups. Women cycle far less than men in the US and Canada and, in the US, cycling rates among men increased more than women between 2001 and 2009 (Pucher, Buehler and Seinen, 2011). Gender differences in cycling rates may be due to women being more concerned by safety and security when cycling, as well as women’s disproportionately larger role in mobility of care (Pucher, Dill and Handy, 2010). Cycling rates have been found to steadily decline with age in the US and UK, but countries with higher cycling rates such as Germany and the Netherlands have seen bicycling mode share increase among groups over the age of 25 (Pucher and Buehler, 2008). The relationship between personal income and cycling is variable in studies from the US, UK, Germany, and the Netherlands (Heinen, van Wee and Maat, 2010; Parkin, Wardman and Page, 2007; Pucher and Buehler, 2008), although higher rates of cycling for utilitarian purposes have been found among low-income groups in Canada (Winters et al., 2007). In the US, white people have higher bicycle mode shares than those identifying as African American, Hispanic, or Asian, though cycling rates rose more among non-white groups between 2001 and 2009 (Pucher, Buehler and Seinen, 2011). Likewise, in England and Wales, electoral wards with a higher proportion of non-white residents have lower rates of bicycle commuting (Parkin, Wardman and Page, 2007). Geographic factors such as climate, topography, and land-use may also impact bicycle mode share (Heinen, van Wee and Maat, 2010).
In Canada, the demographics of who is cycling has not been documented nationally. This is in part due to the lack of a national household travel survey that would provide data on cycling for all types of trips. The Canadian Census (and 2011 National Household Survey (NHS)) provides data every five years on the main travel mode used for commuting. These data can provide some indication of who is cycling to work in Canada, and how the cycling population is changing over time.
The current study uses Canadian Census and NHS data to provide a nationwide portrait of: 1) how bicycle commute mode share varies by gender, race, income, and age in Canada; 2) how the demographics of bicycle commuters in Canada have (or have not) shifted over the 20-year period between 1996 and 2016; and 3) how bicycle commuting and bicycle commuter demographics vary across metropolitan regions in Canada. Our findings show social patterning, with more cycling by men, people who are white, and people with low incomes, and that patterns are persistent over the two-decade study period. This high-level portrait can provide an indication of the inclusiveness of bicycling in Canada. It allows practitioners to understand how Canada’s bicycling population is changing over time and can provide insight into where attention is needed to create more equitable bicycling systems.
2. Methods
2.1. Data
The only consistent source of cycling data in Canada is on commute to work. We accessed Canadian Census (1996, 2001, 2006, 2016) and National Household Survey data (2011) from the public use microdata files (PUMFs), which are anonymized records, provided by Statistics Canada, of individual census responses (Statistics Canada, 2016). Since 1996, these quinquennial data have provided a relatively consistent national profile of commuter and demographic characteristics. They are collected as part of a long-form census questionnaire that is distributed to a 20% (1996, 2001, and 2006) to 25% (2016) sample of the population. In 2011, the long-form census was replaced with a voluntary National Household Survey (NHS) that largely replicated the questions from the long-form census questionnaire but no longer made responses mandatory (Statistics Canada, 2017a), raising concerns over non-response bias, especially within marginalized populations. A census was administered in 2021 but journey-to-work data have not yet been released to the public. The PUMFs represent 2.7% (2001–2016) to 2.8% (1996) of the Canadian population and include weighting factors for each record that may be applied to the sample to represent the entire Canadian population. To maintain confidentiality, the finest geographic scale reported is the census metropolitan area (CMAs), a geographic unit representing one or more adjacent municipalities with a total population of at least 100,000 centered around a core area with a population of at least 50,000 (Statistics Canada, 2017b). The PUMF provides summary data for the largest CMAs, and groups together smaller CMAs and Census Agglomerations (CAs) that are in the same province (e.g., Abbotsford – Kelowna). All other regions that do not fall within one of the larger CMAs (e.g., small towns) are grouped under the “Other” category. The CMAs provided in the PUMF are listed in Table 1 and visualized in Figure 1. The PUMFs were accessed from the Ontario Data Documentation, Extraction Service and Infrastructure (ODESI) repository through the University of Toronto (Statistics Canada, n.d.).
Population and population density of the Census Metropolitan Areas provided in the PUMF.
| CMA (sorted east to west) | Population (2016) | Population Density (population/km2) |
|---|---|---|
| Halifax | 403,390 | 67.6 |
| Moncton – Saint John | 271,012 | 42.2 |
| Québec | 800,296 | 230.3 |
| Sherbrooke – Trois-Rivières | 368,147 | 143.9 |
| Montréal | 4,098,927 | 883.7 |
| Ottawa – Gatineau | 1,323,783 | 184.7 |
| Kingston – Peterborough | 282,896 | 74.9 |
| Oshawa | 379,848 | 418.3 |
| St. Catharines – Niagara | 406,074 | 284.9 |
| Toronto | 5,928,040 | 945.5 |
| Hamilton | 747,545 | 532.2 |
| Brantford – Guelph – Barrie | 483,246 | 181.8 |
| Kitchener – Cambridge – Waterloo | 523,894 | 473.4 |
| London | 494,069 | 184.5 |
| Greater/Grand Sudbury – Thunder Bay | 286,310 | 41.0 |
| Windsor | 329,144 | 318.8 |
| Winnipeg | 778,489 | 143.9 |
| Regina – Saskatoon | 531,576 | 50.0 |
| Edmonton | 1,321,426 | 134.0 |
| Calgary | 1,392,609 | 265.7 |
| Kelowna – Abbotsford | 375,400 | 98.9 |
| Vancouver | 2,463,431 | 810.2 |
| Victoria | 367,770 | 522.1 |
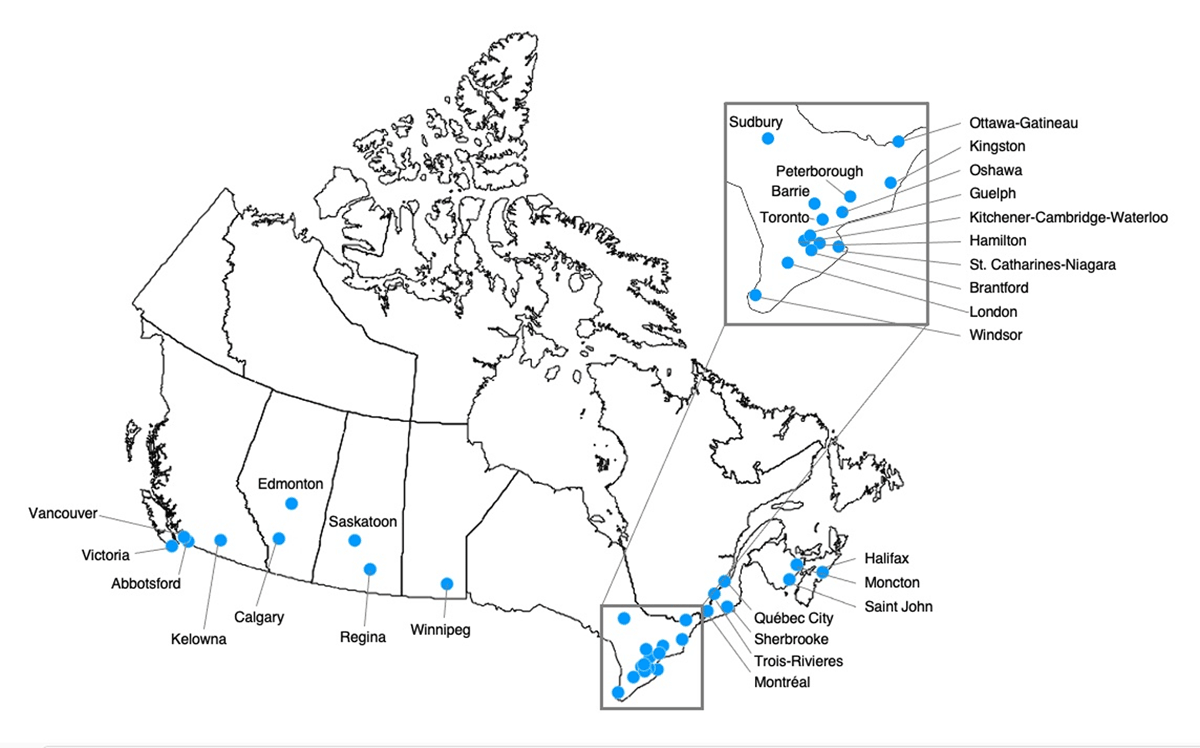
Map of census metropolitan areas included in Statistics Canada public use microdata files (PUMF).
For the main outcome of interest, we used journey-to-work data from the Canadian Census to measure the proportion of the population who cycles to work regularly. The “main mode of commuting” question asks respondents to select a single mode from a list that they usually used to get to work during a week in early May of the census year (Statistics Canada, 2017b). This question has remained consistent since 1996.
The demographic data from the census can be used to further characterize the sample identifying as commuter cyclists. We analyzed weighted subsets of bicycle commuters by gender, race, income, age, and geographic indicators, which are aspects of social identity and contexts that have been shown to have a relationship with bicycling (Heinen, van Wee and Maat, 2010). Below we present details of the social indicators we used.
2.1.1. Gender
Prior to 2021, Statistics Canada only included a “sex” question in the census and NHS, which asked respondents to identify as either male or female, without language specifying that this referred to sex assigned at birth. It is noted that there may be some variation in how respondents interpreted this question (i.e., whether they responded based on their sex at birth, gender identity, or gender expression) and the binary categorization does not accurately represent the gender identity or expression of all Canadians. In this paper we use the terms men and women (rather than male and female) as these terms are more commonly used to reflect gender identity. In these census years there are no response options to speak to other gender identities, although this has changed as of the 2021 census.
2.1.2. Race
Historically, Statistics Canada has reported race using the term “visible minority”, which is drawn from the Canadian Employment Equity Act (Statistics Canada, 2016) and defined there as “persons, other than Aboriginal peoples, who are non-Caucasian in race or non-white in colour” (Employment Equity Act, 1995). The term has come under criticism for “render[ing] invisible the differences in the lived experiences of diverse communities” (United Nations Committee on the Elimination of Racial Discrimination, 2017) and because “visible minorities” in some geographic areas of Canada are in fact the majority, not the minority (Roth, 2017). An Employment Equity Act Review Task Force is currently considering retiring the term from the Act (Government of Canada, 2022).
To derive visible minority data, census respondents are asked to select from a list of population group(s) to which they belong (e.g., white, South Asian, Black), including a “not included elsewhere” option, or a write-in response (Statistics Canada, 2017b). In accordance with the Employment Equity Act (Government of Canada, 1995), those who identify with any population group category other than “white” and who do not identify as “Aboriginal” are classified by Statistics Canada as a visible minority. Approximately 22% of the Canadian population was classified as a visible minority in 2016, although the proportion is much higher in certain metropolitan areas (e.g., 51% in Toronto and 49% in Vancouver). To note, in calculating proportions from the census data we are consistent with Statistics Canada’s approach where “not a visible minority” classification comprises both people identifying as “white” and as “Aboriginal” in these years of the census (Aboriginal people accounted for 4.9% of the total population in 2016 (Statistics Canada, 2016)). We are explicit about this throughout the text. Additionally, in the text that follows we use the terminology of “Indigenous” rather than “Aboriginal”, reflecting current practices. More information on differences in wording and format of questions around Indigeneity as of the 2021 census are available from Statistics Canada (Statistics Canada, 2022).
“Visible minority” data are often interpreted as a measure of race, but race can be identified in many ways, including racial identity (i.e., how individuals identify themselves), observed race (how they are seen by others), reflected race (how they believe they are seen by others), ancestry, amongst others. Roth (2017) describes Statistics Canada’s classification of visible minority as a “proxy for non-white physical appearance”, relying on self-classification as an indicator of white or non-white physical appearance (Roth, 2017). The visible minority data therefore may be interpreted as a proxy for physical appearance, though it must be noted that the data may represent variations in how individual respondents interpreted the question.
2.1.3. Income
The Statistics Canada low-income cut-off (LICO) measure provides a standard indicator of households’ economic positions. LICOs are income thresholds below which households must allocate at least 20% more of their total income on shelter, food, and clothing compared to the average household (Statistics Canada, 2017b). LICOs vary by household size and area type of residence (rural area or small, medium, or large centers by population). LICOs are adjusted each census year to current dollars based on the Consumer Price Index. In 2016, approximately 13% of the total population of Canada was estimated to be a member of a low-income household (before-tax).
2.2. Analysis
We provide a descriptive analysis of bicycle commuting data in Canada. First, we compare bicycle commute mode share (weighted total of individuals who cycle as their main mode of commuting/weighted total of all commuters) among subgroups of gender, race, income, and age indicators, within the most current available census data (2016). We test the statistical significance of differences in bicycle commute mode share between sociodemographic subgroups (e.g., men versus women) using a z-test of equal proportions. The proportions test determines whether there is a statistically significant difference in the proportions of these subgroups that are bicycle commuters while accounting for the proportion of the entire population meeting the same criterion. For example, the proportions test can compare the proportion of men and women who bicycle to work while accounting for the proportion of total commuters who bicycle. Second, we compare changes in mode share over time for each sociodemographic subgroup through line and bar graphs of bicycle commute mode share of the same sociodemographic subgroups (e.g., mode share for women between 1996 to 2016). Third, we provide a visual comparison of bicycle commute mode share of select CMAs and look at differences in trends in bicycle commuting by gender, race, income, and age, across geographies (as provided by PUMF). All analysis was carried out using R software.
3. Results
The number of bicycle commuters in Canada has increased steadily over time, from approximately 178,000 in 1996 to 270,000 in 2016. The rise in the number of people bicycle commuting has outpaced the rise in the number of total commuters driven by population growth; we see this proportionally, where the bicycle commute mode share has increased from 1.3% in 1996 to 1.5% in 2016 (Figure 2).
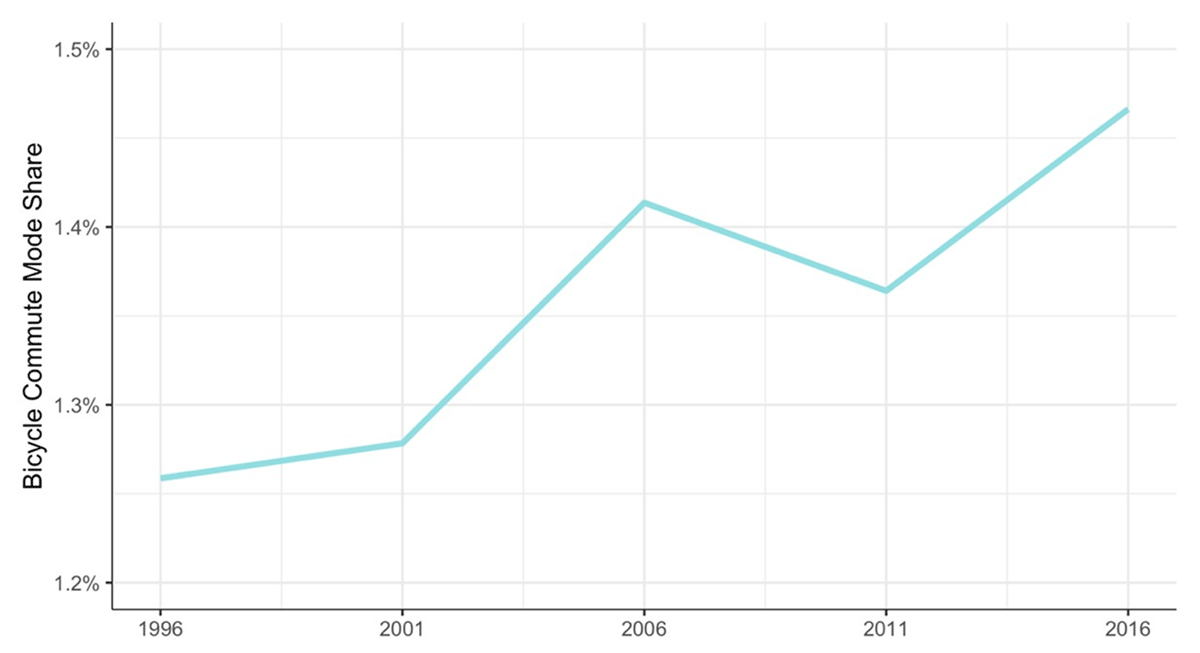
Bicycle commute mode share of the Canadian population (Statistics Canada Journey to Work Data, 1996–2016).
3.1. Sociodemographic characteristics of people bicycle commuting
We report the 2016 rates of bicycle commuting amongst the Canadian population stratified by gender, race, income, and age, as well as differences between demographic subgroups in 2.
Table 2 shows the percentage of each demographic group that bicycles to work, and that the differences between each group and the reference category (women, visible minority, low-income, ages 15–24) is statistically significant. By mode share, men bicycled to work at almost double the rate of women in 2016 (1.9% versus 1.0%). Women slightly outnumbered men in Canada (50.9% of the population) and commuted almost as much (48% of total commuters are women) but only represent about a third of bicycle commuters. Thus, women are underrepresented in commuter bicycling in Canada. Similarly, those identifying as white or Indigenous regularly cycled to work at approximately twice the rate of visible minorities, and those living below the LICO cycled to work at double the rate of those who are not considered low-income. This is indicative of substantial discrepancies between white and non-white bicycle commuting patterns in Canada and a heavier reliance on bicycling by low-income commuters.
Bicycle commute mode share in Canada by sociodemographic characteristics, 2016 (Statistics Canada Journey to Work data, 2016).
| Bicycle Commute Mode Share, 2016 (%) | Difference (%) | |
|---|---|---|
| Gender | ||
| Woman | 1.0 | reference |
| Man | 1.9 | +0.9* |
| Race | ||
| Visible Minority | 0.9 | reference |
| Not a Visible Minority** | 1.6 | +0.7* |
| Income | ||
| Low-Income | 2.8 | reference |
| Not Low-Income | 1.4 | –1.4* |
| Age Group | ||
| 15–24 | 2.2 | reference |
| 25–34 | 2.0 | –0.2* |
| 35–44 | 1.5 | –0.5* |
| 45–54 | 1.1 | –0.4* |
| 55–64 | 0.9 | –0.2* |
| 65+ | 0.6 | –0.3* |
-
* p < 0.05.
** includes both people identifying as white and Indigenous.
To assess how bicycle commute mode share varies across age groups we aggregated the main mode of commuting data into 10-year age categories (15–24, 25–34, 35–44, 45–54, 55–64, and 65+ pooled). Table 2 shows that bicycle commute mode share is lower in older age groups. The gap between mode shares is largest between the middle age categories, indicating that commuting to work by bicycle drops off for people in their late 20s and 30s.
3.2. Sociodemographic characteristics of people bicycle commuting over time
This section presents bicycle commuting rates by gender, race, income, and age for all census years between 1996 and 2016.
3.2.1. Gender
Figure 3 shows the Canada-wide bicycle commute mode share for men and women between 1996 and 2016. As in 2016, men have cycled to work at approximately double the rate as women across all census years analyzed. However, the proportion of women cycling to work has increased consistently each census year, from 0.7% in 1996 to 1.0% in 2016, whilst bicycle commute mode share for men is increasing variably and at a slower pace (from 1.7% in 1996 to 1.8% in 2016, peaking at 1.9% in 2006). Overall, women remain underrepresented as bicycle commuters in Canada, but the gap between men and women has narrowed over time.
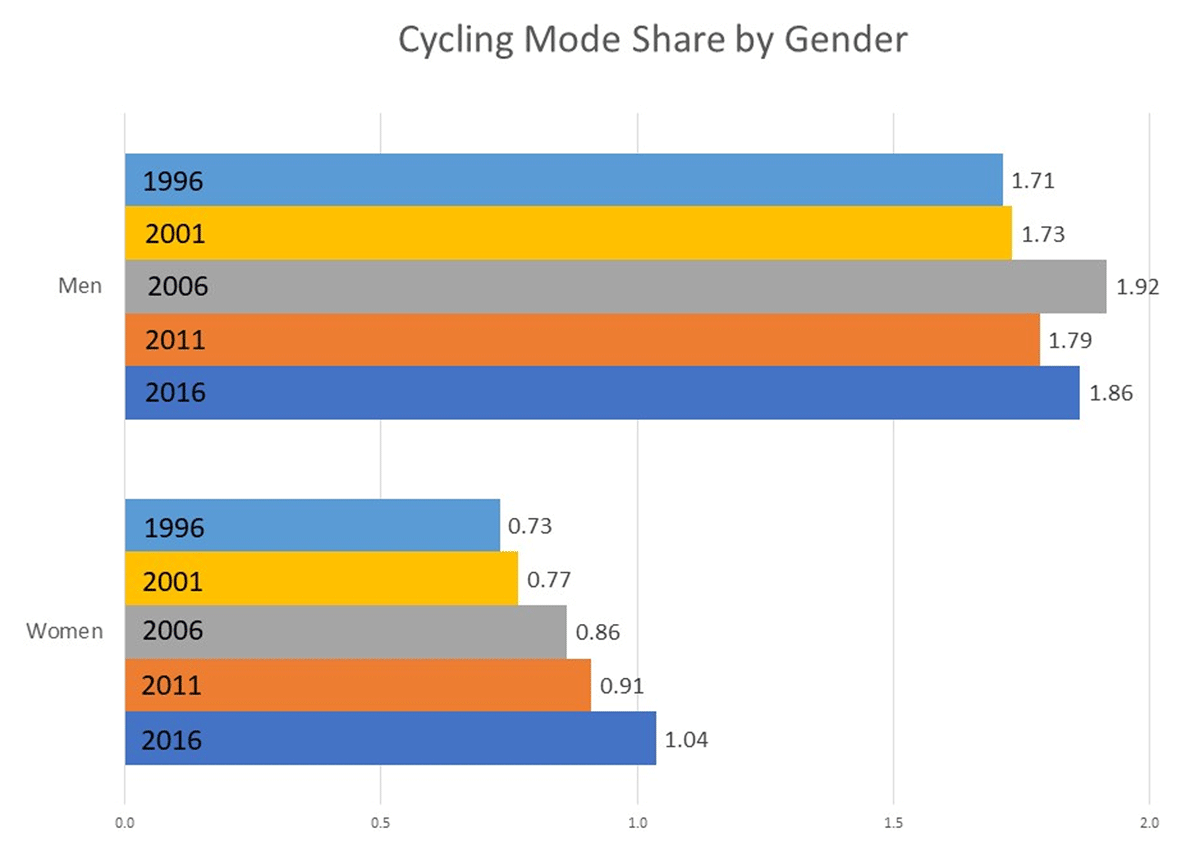
Bicycle commute mode share in Canada by gender (Statistics Canada Journey to Work data, 1996–2016).
3.2.2. Race
The mode share of bicycle commuters over time in Canada are summarized by visible minority status in Figure 4. People who are visible minorities cycled to work at approximately half the rate of non-visible minority (white and Indigenous) commuters across all census years. Mode share is increasing over time, but slowly, for both groups (an approximately 0.1% increase for both between 1996 and 2016). These changes occurred as the visible minority population in Canada was growing substantially, almost doubling from 11.5% in 1996 to 21.6% in 2016. There appear to be major and continuing discrepancies in bicycle commuting by these racial groupings in Canada.
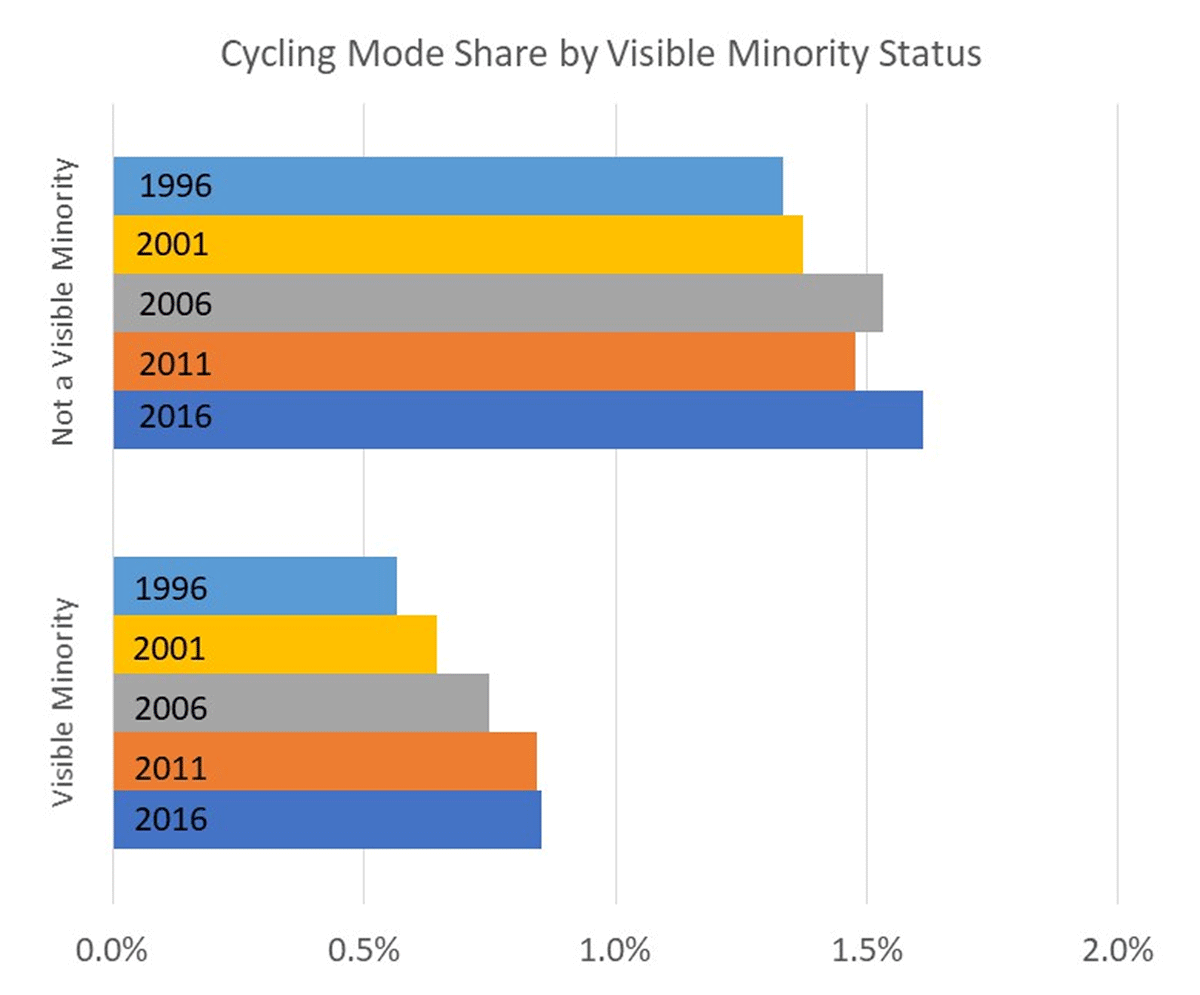
Bicycle commute mode share in Canada by visible minority status (Statistics Canada Journey to Work data, 1996–2016).
3.2.3. Income
The bicycle commute mode share of the Canadian populations living below and above the before-tax LICO are presented for the 20-year study period in Figure 5. Across all census years, people living with low incomes consistently cycled to work at much higher rates than those with higher incomes. Bicycle commuting is increasing at similar rates between 1996 and 2016 for both groups (2.2% to 2.8% for the low-income group and 1.1% to 1.4% for the rest of the population), though rates are increasing more consistently for the low-income group.
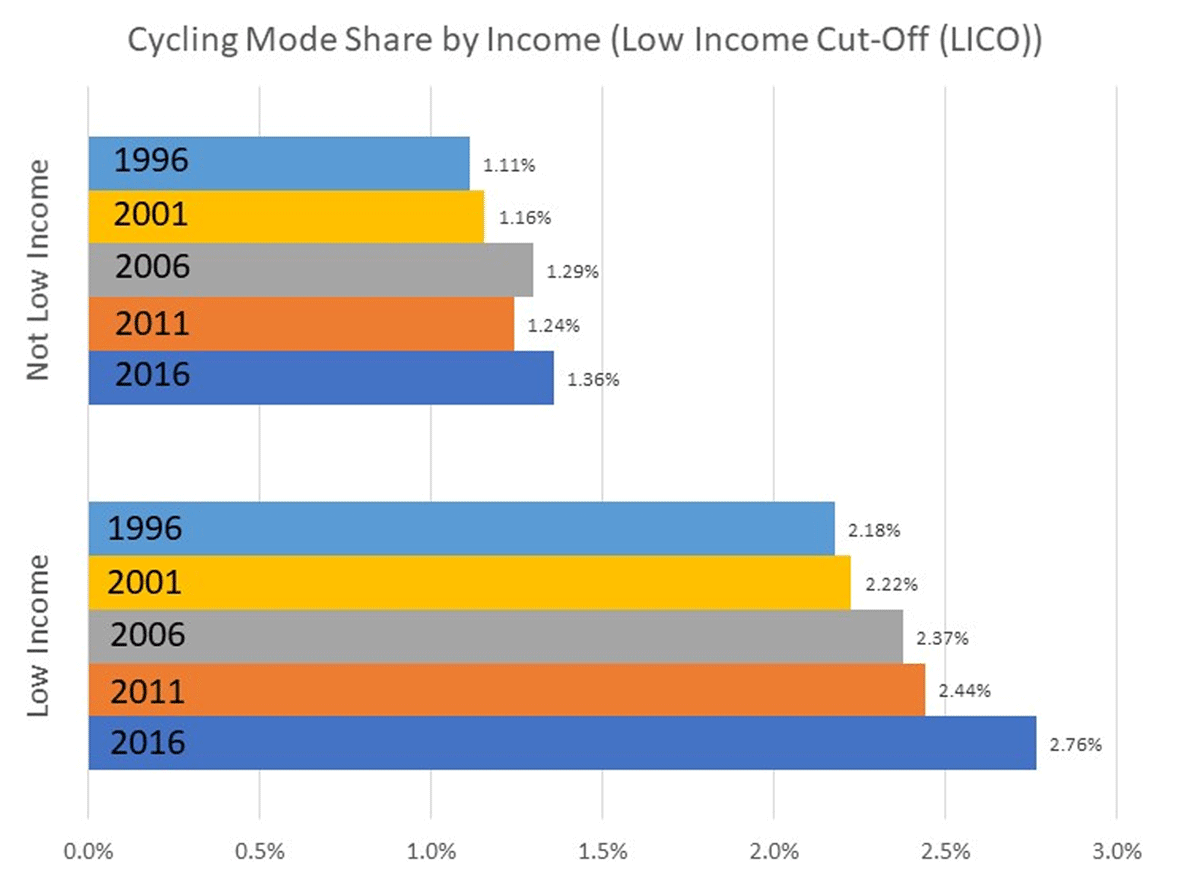
Bicycle commute mode share in Canada by low-income cut-off (LICO) status (Statistics Canada Journey to Work data, 1996–2016).
3.2.4. Age
Figure 6 highlights that younger people have a higher bicycle mode share across all census years. For age groups over 25 years, we see a pattern of bicycle commute mode shares generally increasing over time. However, in the youngest age group (15–24 years), we see declines over time. Thus, even as this younger population is cycling to work more than other age groups, over time, cohorts of young people are less likely to be cycling.
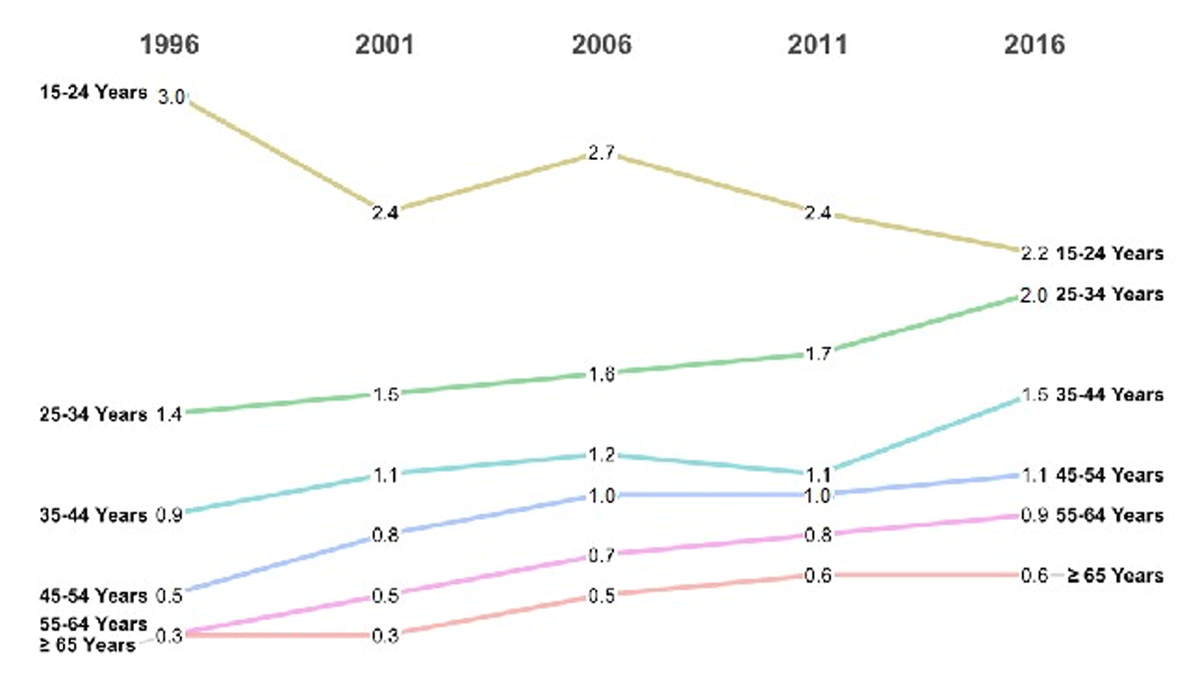
Bicycle commute mode share (%) in Canada by age group (Statistics Canada Journey to Work Data, 1996–2016).
3.3. Geographic variations in bicycle commute mode share
Bicycling policy and infrastructure decisions in Canada are most often made at the municipal level. Even within municipalities, the provision of bicycling infrastructure and factors such as topography vary by neighborhood. The promotion of bicycling, attitudes towards bicycling, as well as other environmental factors such as climate, is thus highly localized (Heinen, van Wee and Maat, 2010). The census/NHS PUMF can only be disaggregated to the CMA level, which often includes multiple municipalities but can provide an indication of how levels of bicycle commuting vary by region. Bicycle commute mode share for select CMAs available in the PUMF Census data are presented in Figure 7.
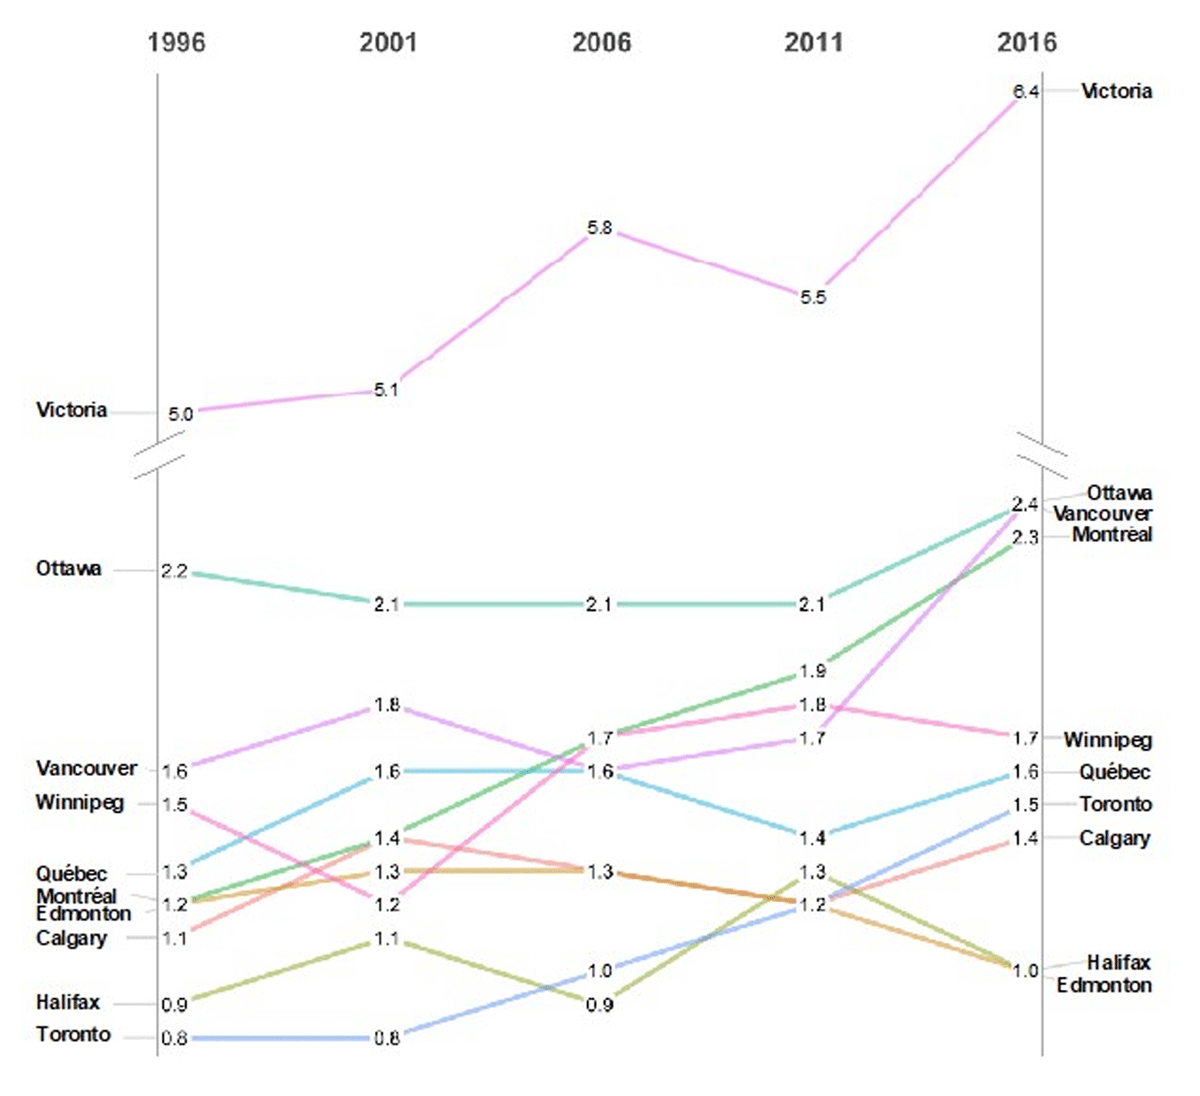
Bicycle commute mode share for the two largest census metropolitan areas in each Canadian province (Statistics Canada Journey to Work data, 1996–2016).
Victoria, British Columbia consistently had at least triple the bicycle commute mode share of the other CMAs. The mode share in Victoria also rose considerably, from 5.0% in 1996 to 6.4% in 2016. The three most populous CMAs (Toronto, Vancouver, and Montréal) have all seen substantial increases in bicycle commute mode share over the two decades, although Toronto’s mode share remains among the lowest.
A disaggregated exploration of bicycle commute mode share by geography reveals regional variability in some of the above results presented in Section 3.2 (Table 3). The grey cells indicate geographical areas where specific equity-deserving groups may be commuting by bicycle more, relatively speaking, although ratios should be taken in context of the absolute mode shares (e.g., higher ratio between groups are more likely in areas with low absolute mode shares). There were no CMAs where women’s bicycle commute mode share was equal to or greater than those by men. Men consistently commuted by bike at 1.5–2 times the rate of women across the country, and as high as 6 times higher in Oshawa, a suburban municipality with limited bicycling infrastructure. The two areas with the tightest gender split (ratio of 1.3) were Moncton – Saint John, and Kelowna – Abbotsford. Across most cities, people who are classified as visible minorities had lower bicycle mode shares than non-visible minorities, with the exception of Sherbrooke – Trois-Rivières and Windsor (where visible minorities had higher mode share), and Oshawa (where cycling was low overall, but equal across race). An interesting contrast is that in areas outside the larger CMAs, people who are visible minorities commute by bicycle at higher rates (1.5%) than those who are not visible minorities (0.5%). Finally, the data show a consistent trend that low-income groups had higher bicycle commute mode shares than the rest of the population in all CMAs except Calgary, Alberta. The relatively higher rates of commuter cycling for both visible minority groups and low-incomes outside of the larger CMAs (e.g., in smaller, more car-centric CMAs, and outside urban areas) may be indicative of constraints in transportation alternatives leading to these groups facing structural disadvantage to commute by bicycle, rather than a choice between a set of transportation alternatives that more affluent and white populations may have.
Bicycle commute mode share sociodemographic characteristics by geography, 2016 (Statistics Canada Journey to Work data, 2016).
| Bicycle mode share (2016 census) | |||||||||
|---|---|---|---|---|---|---|---|---|---|
| CMA (sorted east to west) | Gender | Race** | Income*** | ||||||
| Woman | Man | ratio(men/women) | Visible Minority (VM) | Not a Visible Minority | ratio (not a VM/VM) | LICO | Not-LICO | ratio (not LICO/LICO) | |
| Halifax | 0.7 | 1.2 | 1.7 | 0.0 | 1.0 | n/a | 2.2 | 0.9 | 0.4 |
| Moncton – Saint John | 0.3 | 0.4 | 1.3 | 0.0 | 0.4 | n/a | 1.5 | 0.3 | 0.2 |
| Québec | 0.8 | 2.3 | 2.9 | 0.5 | 1.6 | 3.2 | 3.9 | 1.4 | 0.4 |
| Sherbrooke – Trois-Rivières | 0.7 | 1.2 | 1.7 | 1.1 | 0.9 | 0.8 | 1.8 | 0.9 | 0.5 |
| Montréal | 1.6 | 2.9 | 1.8 | 1.1 | 2.6 | 2.4 | 4.6 | 2.0 | 0.4 |
| Ottawa – Gatineau | 1.6 | 3.2 | 2.0 | 1.2 | 2.7 | 2.3 | 4.4 | 2.3 | 0.5 |
| Kingston – Peterborough | 1.3 | 2.2 | 1.7 | 0.9 | 1.7 | 1.9 | 3.0 | 1.7 | 0.6 |
| Oshawa | 0.1 | 0.6 | 6.0 | 0.3 | 0.3 | 1.0 | 1.2 | 0.3 | 0.3 |
| St. Catharines – Niagara | 0.6 | 1.3 | 2.2 | 0.3 | 1.0 | 3.3 | 2.1 | 0.9 | 0.4 |
| Toronto | 1.1 | 1.8 | 1.6 | 0.8 | 2.1 | 2.6 | 2.4 | 1.4 | 0.6 |
| Hamilton | 0.5 | 1.6 | 3.2 | 0.2 | 1.2 | 6.0 | 2.4 | 0.9 | 0.4 |
| Brantford – Guelph – Barrie | 0.5 | 1.4 | 2.8 | 0.6 | 1.0 | 1.7 | 1.4 | 0.9 | 0.6 |
| Kitchener – Cambridge – Waterloo | 0.6 | 2.0 | 3.3 | 0.4 | 1.5 | 3.8 | 2.1 | 1.3 | 0.6 |
| London | 0.9 | 1.8 | 2.0 | 0.6 | 1.5 | 2.5 | 2.6 | 1.3 | 0.5 |
| Greater/Grand Sudbury – Thunder Bay | 0.5 | 1.1 | 2.2 | 0.0 | 0.8 | n/a | 2.6 | 0.7 | 0.3 |
| Windsor | 0.6 | 1.5 | 2.5 | 1.9 | 1.0 | 0.5 | 1.6 | 1.0 | 0.6 |
| Winnipeg | 1.1 | 2.2 | 2.0 | 0.4 | 2.0 | 5.0 | 2.3 | 1.6 | 0.7 |
| Regina – Saskatoon | 1.2 | 2.0 | 1.7 | 0.5 | 1.7 | 3.4 | 3.1 | 1.5 | 0.5 |
| Calgary | 0.9 | 1.8 | 2.0 | 0.6 | 1.7 | 2.8 | 1.2 | 1.4 | 1.2 |
| Edmonton | 0.7 | 1.2 | 1.7 | 0.4 | 1.2 | 3.0 | 1.5 | 0.9 | 0.6 |
| Kelowna – Abbotsford | 1.4 | 1.8 | 1.3 | 0.7 | 1.8 | 2.6 | 3.7 | 1.5 | 0.4 |
| Vancouver | 1.8 | 2.9 | 1.6 | 1.0 | 3.5 | 3.5 | 2.8 | 2.3 | 0.8 |
| Victoria | 5.2 | 7.7 | 1.5 | 4.1 | 6.8 | 1.7 | 7.3 | 6.4 | 0.9 |
| Other smaller CMAs, CAs and non-CMA/CA | 0.6 | 1.1 | 1.8 | 1.5 | 0.8 | 0.5 | 2.0 | 0.8 | 0.4 |
-
*Geography aggregations as provided by PUMF. The larger CMAs are presented independently; some others are combined. The PUMF also provides data on “other CMAs, CAs, and non-CMA/CA, which is used here as the comparator data for the rest of Canada.
** includes both people identifying as white and Indigenous.
*** LICO = Statistics Canada low-income cut-off (before tax).
Grey cells indicate geographical areas where specific equity-deserving groups may be commuting by bicycle more.
4. Discussion
Our analysis presents evidence of who bicycles, how bicycling rates vary by region, and how these demographics are changing over time. We found significant differences in terms of who bicycles by gender, race, age, and income with little variation in these differences over time, illustrating a persistent demographic patterning of who commutes by bicycle in Canada. In the following sections, we compare the results to similar studies using national datasets in other North American and Western European countries and discuss some potential causes of discrepancies across groups. We then explore how bicycle commuting rates vary when considering intersecting identities in Canada.
4.1. Gender
Our analysis found that men commute by bicycle at approximately twice the rate of women in Canada, but rates of bicycle commuting are increasing faster for women than men. The overarching gap is consistent with previous research which has found that in western countries where bicycle mode share is low overall, men cycle more than women (Heinen, van Wee and Maat, 2010). Women in Canada cycle at similar rates to the UK (29% of bicycle trips are taken by women) and at higher rates than in the US (25%) and Australia (21%) (Pucher and Buehler, 2008). The consistently lower bicycle mode share for women is indicative of widely studied barriers to cycling and cultural limitations that some women face while cycling in North America, including an enhanced fear of violence and harassment in public space relative to men, lower confidence in mixed-traffic conditions, expectations of appearance when arriving at workplaces, and childcare responsibilities (Lubitow, 2017). Studies have shown that women have stronger preferences than men for bicycling infrastructure with physical separation from motor vehicles (Garrard, Rose and Lo, 2007; Twaddle, Hall and Bracic, 2010). The increasing bicycle mode share for women may indicate slight shifts towards gender equality in cycling in Canada.
4.2. Race
We found that Canadians who Statistics Canada identifies as ‘visible minorities’ cycle to work at approximately half the rate of white and Indigenous people, and both groups have shown increasing mode share at similar rates. Pucher et al. (2011) similarly found that cycling rates are twice as high amongst white populations in the US, as compared to Hispanic and African American groups, although cycling rates were increasing in non-white demographics but not amongst white demographics. In England, utilitarian cycling rates among non-white individuals are approximately 60% the rates of white individuals, and recreational rates are only 50% (Goodman and Aldred, 2018). These differences are also found in countries where the overall prevalence is high, such as the Netherlands, where ethnic minorities bicycle less (Fishman, Böcker and Helbich, 2015).
These findings support the common belief that utilitarian cyclists are primarily white (Agyeman and Doran, 2021; Lubitow, 2017). The “not visible minority” population in our analysis comprised both Indigenous people and white populations, consistent with historical Statistics Canada classifications, although the absolute number of Indigenous people bicycle commuting is small, relative to white cyclists (~8,300 and 220,000, respectively, in 2016). Evidence suggests that racialized populations are facing pervasive barriers to cycling in western countries. For example, many barriers in the US are because of systemic racism, such as fears of police and other violence, harassment, and microaggressions through other road users’ behavior when navigating public space, commonly referred to as “Biking While Black” (Barajas 2021; Lubitow, 2017). In England, lower cycling rates amongst non-white people have been attributed to cultural associations of cycling with low social status and infantilism, preferences for more modest clothing, and low coverage of cycling in Black media (Steinbach et al., 2011). Low cycling rates may also be related to lower bicycling infrastructure investment in neighborhoods with higher proportions of racialized residents, a pattern seen in some North American cities but not others (Flanagan, Lachapelle and El-Geneidy, 2016).
4.3. Income
We identified a significantly higher bicycle commute mode share among the low-income population compared to the rest of the population, with the difference in mode share between the two groups remaining relatively consistent between 1996 and 2016. Analysis of other national datasets from western countries have not identified such a discrepancy in cycling rates across income groups. Pucher and Buehler (2008) found that cycling rates are similar across income groups in the US, the UK, Germany, the Netherlands, and Denmark. This result is based on bicycling trips of all purposes, but other studies have found that recreational bicycling is more prevalent among higher-income groups (Heinen, van Wee and Maat, 2010). Within the Canadian context, Winters et al. (2007) used the national Canadian Community Health Survey to identify an inverse relationship between household incomes and utilitarian bicycling (work, school, or errands). The high cycling rates amongst the low-income population found in this analysis therefore may be due to low-income commuters’ higher reliance on bicycling as a lower-cost transportation alternative, whereas those with higher incomes may choose to bicycle when there are comfortable conditions (e.g., high-quality bicycling infrastructure, favorable weather) (Pucher, Buehler and Seinen, 2011). Those with higher incomes are more likely to own a car and are generally better able to spend more money on transportation, allowing them more travel alternatives to choose other than bicycling if conditions are unsafe or uncomfortable (Heinen, van Wee and Maat, 2010). Thus, these Canadian results combined with the other research on the prominence of recreational bicycling among higher-income groups may point to a division in bicycling trip purposes along socioeconomic lines, where mid- to high-income earners bicycle for leisure or as a choice among several transportation options, whereas low-income earners bicycle out of necessity for a low-cost transportation alternative (Pucher, Buehler and Seinen, 2011).
4.4. Age
While we see expected patterns of decreasing bicycling within increasing age groups, we importantly see a pattern of increasing commuter bicycling within each age group. The one exception is the youngest age group analyzed (15–24 years), which appears to have lower rates of bicycling in more recent census years, though their mode shares remain higher than older age groups. Our results generally reflect findings from the US and UK that bicycling rates decline as age groups increase, with a sharp decrease between the teenage years and 20s (Pucher and Buehler, 2008). It is commonly assumed that decreasing bicycling rates with age are due to declining physical ability, but research has indicated that cultural factors and infrastructure preferences among older adults are also at play (Aldred, Woodcock and Goodman, 2016). The perception of a typical cyclist being young and athletic can feel exclusionary to older adults (Lubitow, 2017). Older adults are often more constrained by their stronger preferences for bicycling infrastructure with physical separation from motor vehicle traffic (Van Cauwenberg et al., 2019). A contributing factor to the rapid decrease in bicycle commute mode share between the 15–24 and 35–44 age groups may be experiencing a major life event, such as changing jobs, relationship changes, moving, and increasing caregiving responsibilities (Chatterjee, Sherwin and Jain, 2013).
4.5. Intersections of sociodemographic characteristics
There is a need to advance intersectional perspectives in cycling research and practice (Lam, 2022). Structural forces compound and interact such that individuals’ intersecting spatial and social identities face unique barriers; travel behavior cannot be fully explained by a single aspect of one’s identity. For example, if the journey-to-work data are further stratified by age and gender, we see that the 2016 bicycle commute mode share for racialized women is only 0.6%, half the rate of all women (1.2%) and racialized men (1.1%). Stratifying bicycle commute mode share by gender and income shows that bicycle mode share for low-income women is 2.2% compared to 1.0% women who are not low-income, and 3.6% for low-income men compared to 1.8% for men who are not low-income. Efforts towards equitable bicycling in Canada must consider the intersecting barriers and constraints to bicycling that people might experience based on overlapping systems of oppression, as well as explore whether people are bicycling as a choice or because there are limited alternative transportation options available. The Canadian Census PUMFs are well-suited for surfacing differences in bicycle commute mode share as they provide individual records from which the user can generate custom crosstabs across sociodemographic characteristics and commuting behavior. Future research can capitalize on this opportunity that the PUMFs provide and complement this data qualitative analysis to surface reasons for why these differences are occurring.
5. Data limitations
The Census provides the best available snapshot of the Canadian population over time. Still, Statistics Canada cautions comparing data from different surveys due to variations in methodology, quality, and definitions of the target population (Statistics Canada, 2017b). The largest inconsistency during the 1996–2016 study period is the voluntary 2011 NHS. While the mandatory census has a very high response rate—up to 96.9% in 2016—the 2011 NHS only yielded a 68.6% response rate (Statistics Canada, 2017a). The dip in total bicycle commuting in 2011 (see Figure 1) may be a result of this non-response bias.
The journey-to-work data are valuable in that they represent the entire Canadian population. However, they are limited as a bicycling data source in that they only include a count of commuters who primarily bicycle, excluding less-frequent cyclists, multi-modal trips, and cycling trips for non-work purposes. Countries such as the US, UK, and Germany conduct national household travel surveys, which can allow for more robust, individual-level statistical analysis because they usually collect data on individual trips and often collect demographic information (e.g., gender and age). Many municipalities and regions across Canada administer travel surveys (e.g., the Greater Golden Horseshoe Transportation Tomorrow Survey, Metro Vancouver Regional Trip Diary Survey), but they are initiated at the will of individual authorities and not representative of all geographies in Canada, particularly smaller cities and rural areas with limited funding.
The current study looked at geographical patterns in demographic bicycling trends in a selection of metropolitan areas. Bicycling mode share and the demographic composition of who is bicycling is certainly related land use patterns and transportation infrastructure. Recent efforts have created measures of the amount and quality of bicycling infrastructure for all communities in Canada, at the level of dissemination areas (400–700 people) (Winters et al., 2022). National measures of urban form such as this can be linked to mode share data from the census used to explore patterns between the built environment and social equity in who bicycles.
6. Policy opportunities
The findings from this analysis can help to guide Canadian planning authorities in their pursuit of more equitable and sustainable bicycling systems (Doran, El-Geneidy and Manaugh, 2021). While a better understanding must be established on the barriers and constraints that different groups face leading them to (or not to) cycle to work, how intersecting identities affect these barriers and constraints, and the localized differences in cycling rates, this high-level analysis can broadly point to a more equitable policy direction. For example, continued and increased investment in high-quality bicycling infrastructure with physical separation from motor vehicle traffic can specifically encourage bicycling by women and older adults. Facilitating the younger generation’s preference for living downtown and in central areas through land-use policy and transit systems would support shorter trips taken by bicycle and could aim to prevent the mode shift away from cycling seen in young adults (Delbosc and Nakanishi, 2017). Expansion of programs promoting active travel to school, such as Active & Safe Routes to School, may also help to dissuade future generations from making a shift away from bicycling. Importantly, the substantial barriers that BIPOC and women face in public space have seemingly in part led to their underrepresentation in bicycle commuting in Canada. This points to greater systemic issues of racism and cultural barriers, but increased engagement with these communities in the planning process may help to facilitate their inclusion in a bicycling-supportive culture (Lubitow and Miller, 2013).
7. Conclusions
This national portrait of bicycle commuters provides one of the first nationwide overviews of bicycling patterns amongst sociodemographic groups in Canada, and one of the first amongst western countries analyzing across multiple census years. It highlights clear discrepancies in bicycle commuting rates between sociodemographic subgroups. Men, non-visible minority populations (including both white and Indigenous people), low-income, and younger groups all commute by bicycle at higher rates than comparison sub-groups. Our results were consistent with the findings from North America and Western European countries, in general, where men bicycle more than women (aside from stand out examples such as Copenhagen and the Netherlands), and racialized people bicycle at lower rates than non-racialized people. Interestingly, our work found a higher bicycle commute mode share for people with lower incomes, relative to others; this finding differs from other studies, especially those that include leisure bicycling.
The implications of these differences may vary by group. For example, men may cycle more nationwide because of societal conditions that have privileged them in cycling culture, whereas higher bicycle commuting rates for visible minority and low-income groups in smaller, more car-centric CMAs may be a result of limited transportation alternatives rather than a choice to bicycle. Mode share is a broad measure reflecting both choices and constraints inherent to the complexities of travel behavior. Barriers and facilitators to cycling specifically in the Canadian context must be understood before any direct policy action can be taken. Specifically addressing inequities in bicycle commuting can accelerate the progress towards wide adoption of bicycling as a viable and equitable travel alternative in Canada.
Acknowledgements
This paper draws on research supported by the Social Sciences and Humanities Research Council’s partnership grant: Mobilizing justice: towards evidence-based transportation equity policy. Kate Hosford is supported by the Social Sciences and Humanities Research Council (Doctoral Award) and Meghan Winters is supported by a CIHR/PHAC Applied Public Health Chair (Gender and Sex in Healthy Cities). The authors would also like to acknowledge Dr. Nicholas J. Klein for his input and feedback on the analysis.
Competing Interests
The authors have no competing interests to declare.
References
1 Agyeman, J. and Doran, A. (2021). “You want protected bike lanes, I want protected Black children. Let’s link”: equity, justice, and the barriers to active transportation in North America. Local Environment, 26(12), 1480–1497.
2 Aldred, R., Woodcock, J. and Goodman, A. (2016). Does more cycling mean more diversity in cycling? Transport Reviews, 36(1), 28–44.
3 Barajas, J. M. (2021). Biking where Black: connecting transportation planning and infrastructure to disproportionate policing. Transportation Research Part D: Transport and Environment. 99, 103027.
4 Braun, L. M., Rodriguez, D. A. and Gordon-Larsen, P. (2019). Social (in)equity in access to cycling infrastructure: cross-sectional associations between bike lanes and area-level sociodemographic characteristics in 22 large U.S. cities. Journal of Transport Geography, 80, 102544.
5 Briseño, M., Comas, M., Durley, K., McFarland, A. and Wainer, A. (2019). More than bike lanes: from bike equity to bike justice in Greater Boston. Tufts University Urban & Environmental Planning & Policy. Available from https://tufts.app.box.com/s/t9gzbpbtkl0iz92a2xf4f5ppwvdeuii7. [Accessed 9 November 2022].
6 Chatterjee, K., Sherwin, H. and Jain, J. (2013). Triggers for changes in cycling: The role of life events and modifications to the external environment. Journal of Transport Geography, 30, 183–193.
7 City of Ottawa. (2013). Ottawa Cycling Plan. Available from https://documents.ottawa.ca/sites/documents/files/documents/ocp2013_report_en.pdf [Accessed 9 November 2022].
8 Delbosc, A. and Nakanishi, H. (2017). A life course perspective on the travel of Australian Millennials. Transportation Research Part A, 104, 319–336.
9 Doran, A., El-Geneidy, A. and Manaugh, K. (2021). The pursuit of cycling equity: a review of Canadian transport plans. Journal of Transport Geography, 90, 102927.
10 Ferenchak, N. N. and Marshall, W. E. (2021). Bicycling facility inequalities and the causality dilemma with socioeconomic/sociodemographic change. Transportation Research Part D: Transport and Environment, 97, 102920.
11 Fishman, E., Böcker, L. and Helbich, M. (2015). Adult active transport in the Netherlands: an analysis of its contribution to physical activity requirements. PloS One(10), e0121871.
12 Flanagan, E., Lachapelle, U. and El-Geneidy, A. (2016). Riding tandem: does cycling infrastructure investment mirror gentrification and privilege in Portland, OR and Chicago, IL? Research in Transportation Economics, 60, 14–24.
13 Fuller, D. and Winters, M. (2017). Income inequalities in Bike Score and bicycling to work in Canada. Journal of Transport & Health, 7(Part B), 264–268.
14 Garrard, J., Rose, G. and Lo, S. K. (2007). Promoting transportation cycling for women: the role of bicycle infrastructure. Preventive Medicine, 46(1), 55–59.
15 Golub, A. (2016). Is the right to bicycle a civil right? Synergies and tensions between the transportation justice movement and planning for bicycling. In: Golub, A., Hoffman, M., Lugo, A, and Sandoval, G. (eds.) Bicycle justice and urban transformation: biking for all? Routledge, 20–31.
16 Goodman, A. and Aldred, R. (2018). Inequalities in utility and leisure cycling in England, and Variation by Local Cycling Prevalence. Transportation Research Part F, 56, 381–391.
17 Government of Canada. (1995). Employment Equity Act, S.C. c. 44. Available from https://laws-lois.justice.gc.ca/eng/acts/e-5.401/. [2 Accessed June 2022].
18 Government of Canada. (2022). Terms of Reference – Employment Equity Act Review Task Force. Available from https://www.canada.ca/en/employment-social-development/corporate/portfolio/labour/programs/employment-equity/task-force/terms-reference.html. [Accessed 2 June 2022].
19 Heinen, E, van Wee, B. and Maat, K. (2010). Commuting by bicycle: an overview of the literature. Transport Reviews, 30(1), 59–96.
20 Hosford, K. and Winters, M. (2018). Who are public bicycle share programs serving? An evaluation of the equity of spatial access to bicycle share service areas in Canadian cities. Transportation Research Record, 2672(36), 42–50.
21 HUB Cycling and TransLink. (2019). Benchmarking the state of cycling in metro Vancouver. Available from https://bikehub.ca/research/the-state-of-cycling-in-metro-vancouver. [Accessed 9 November 2022].
22 Jahanshahi, D., Chowdhury, S., Costello, S. B. and van Wee, B. (2021). Review of key findings and future directions for assessing equitable cycling usage. Transportation Research Record, 2675(6), 453–464.
23 Lam, T. (2022). Towards an intersectional perspective in cycling. Active Travel Studies, 2(1). Available from DOI: http://doi.org/10.16997/ats.1264
24 Lubitow, A. (2017). Narratives of marginalized cyclists: understanding obstacles to utilitarian cycling among women and minorities in Portland, OR. NITC-SS-994. Transportation Research and Education Center (TREC), Portland, OR. Available from https://pdxscholar.library.pdx.edu/trec_reports/134/. [Accessed 9 November 2022].
25 Lubitow, A. and Miller, T. R. (2013). Contesting sustainability: bikes, race, and politics in Portlandia. Environmental Justice, 6(4), 121–126.
26 Manaugh, K., Badami, M. G. and El-Geneidy, A. M. (2015). Integrating social equity into urban transportation planning: a critical evaluation of equity objectives and measures in transportation plans in North America. Transport Policy, 37, 167–176.
27 Martens, K., Piatkowski, D. P. and Krizek, K. (2016). Advancing discussions of cycling interventions based on social justice. In: Golub, A., Hoffman, M., Lugo, A, and Sandoval, G. (eds.) Bicycle justice and urban transformation: biking for all? Routledge, 86–99.
28 Parkin, J., Wardman, M. and Page, M. (2007). Estimation of the determinants of bicycle mode share for the journey to work using census data. Transportation, 35(1), 93–109.
29 Pereira, R. H. M., Schwanen, T. and Banister, D. (2017). Distributive justice and equity in transportation. Transport Reviews, 37(2), 170–191.
30 Pucher, J. and Buehler, R. (2008). Making cycling irresistible: lessons from The Netherlands, Denmark and Germany. Transport Reviews, 28(4), 495–528.
31 Pucher, J., Buehler, R., Merom, D. and Bauman, A. (2011). Walking and cycling in the United States, 2001–2009: evidence from the National Household Travel surveys. American Journal of Public Health, 101(S1), S310–S317.
32 Pucher, J., Buehler, R. and Seinen, M. (2011). Bicycling renaissance in North America? An update and re-appraisal of cycling trends and policies. Transportation Research Part A: Policy and Practice, 45(6), 451–475.
33 Pucher, J., Dill, J. and Handy, S. (2010). Infrastructure, programs, and policies to increase bicycling: an international review. Preventative Medicine, 50, S106–S125.
34 Roth, W. D. (2017). Methodological pitfalls of measuring race: International comparisons and repurposing of statistical categories. Ethnic and Racial Studies, 40(13), 2347–2353.
35 Sheller, M. (2020). Mobility justice. Handbook of research methods and applications for mobilities, Edward Elgar Publishing, 11–20.
36 Soliz, A. (2021). Divergent infrastructure: uncovering alternative pathways in urban velomobilities. Journal of Transport Geography, 90, 102926.
37 Statistics Canada. (1996). 1996 Census of Population [Canada] Public Use Microdata Files (PUMF): Individuals File. Catalogue No. 93F0026XDB96004.
38 Statistics Canada. (2016). 2016 Census Public Use Microdata File (PUMF): Individuals File. Catalogue No. 98M0001X.
39 Statistics Canada. (2017a). Guide to the Census of Population, 2016. Available from https://www12.statcan.gc.ca/census-recensement/2016/ref/98-304/index-eng.cfm. [Accessed 8 June 2022].
40 Statistics Canada. (2017b). Dictionary, Census of Population, 2016. Available from https://www12.statcan.gc.ca/census-recensement/2016/ref/dict/index-eng.cfm. [Accessed 8 June 2022].
41 Statistics Canada. (2022). Indigenous Peoples Reference Guide, Census of Population, 2021. Available from https://www12.statcan.gc.ca/census-recensement/2021/ref/98-500/009/98-500-x2021009-eng.cfm. [Accessed 9 November 2022].
42 Statistics Canada. (n.d.) Census of Population [Data file]. Data Liberation Initiative [Distributor]. Available from http://odesi2.scholarsportal.info/webview/. [Accessed 29 July 2022].
43 Steinbach, R., Green, J., Datta, J. and Edwards, P. (2011). Cycling and the city: a case study of how gendered, ethnic and class identities can shape healthy transport choices. Social Science & Medicine, 72(7), 1123–1130.
44 Twaddle, H., Hall, F. and Bracic, B. (2010). Latent bicycle commuting demand and effects of gender on commuter cycling and accident rates. Transportation Research Record, 2190(1), 28–36.
45 United Nations Committee on the Elimination of Racial Discrimination. (2017). Concluding observations on the combined twenty-first to twenty-third periodic reports of Canada. Findings from the international convention on the elimination of all forms of racial discrimination, Geneva. Available from https://digitallibrary.un.org/record/1311173?ln=en. [Accessed 2 June 2022].
46 Van Cauwenberg, J., De Bourdeaudhuij, I., Clarys, P., De Geus, B. and Deforche, B. (2019). Older adults’ environmental preferences for transportation cycling. Journal of Transport & Health, 13, 185–199.
47 Winters, M., Beairsto, J., Ferster, C., Laberee, K., Manaugh, K. and Nelson, T. (2022). The Canadian Bikeway Comfort and Safety metrics (CanBICS): national measures of the bicycling environment for use in research and policy. Health Reports, 82-003-X. Available from DOI: http://doi.org/10.25318/82-003-x202201000001-eng
48 Winters, M., Friesen, M. C., Koehoorn, M. and Teschke, K. (2007). Utilitarian bicycling: a multilevel analysis of climate and personal influences. American Journal of Preventive Medicine, 32(1), 52–58.
49 Zimmerman, S., Lieberman, M., Kramer, K. and Sadler, B. (2015). At the intersection of active transportation and equity. Safe Routes to School National Partnership, Oakland. Available from https://www.saferoutespartnership.org/resources/report/intersection-active-transportation-equity. [Accessed 9 November 2022].