Introduction
“Artists are being approached more than ever to help develop imaginative solutions that engage the public with scientific research” (Roughley and Smith et al., 2019). There are constant challenges within the scientific community of how to reach or influence the general public. Public perceptions of science and public communication of science and scientific expertise can often be misunderstood. Scientific research papers frequently include complex language and terminology that is often shared knowledge between scientific academics. This makes the likelihood of engagement from the public challenging and therefore uncommon.
Artists not only engineer creative responses to complex problems but also disseminate this to an audience. When the term audience is used within this paper, it is referring to members of the public who may not ordinarily delve into research journals or scrutinise scientific themes connected with this research, such as ecology and the environment. Artists, in many ways, can help to bridge this gap, either by positioning work within a traditional white cube gallery or, perhaps more successfully and directly, within the public sphere. Exhibiting work within a public site may increase the level of the audience’s agency through interactivity, emotional connection, conversation, and exchange.
In 2018, Danish-Icelandic artist Olafur Eliasson displayed thirty blocks of glacial ice from Greenland adjacent to the Tate Modern in London where, over time, the ice was left to melt. Ice Watch highlighted the pressing issue of climate change, specifically rising sea levels in connection to melting glaciers. It brought attention to a fairly abstract concept in our minds, to an all-confronting reality. The public interacted with the ice by touching it, feeling its temperature, and listening to the sounds of air escaping, air that had been trapped within the ice for thousands of years. Suddenly the concept of climate change was foreboding, active, alive, and happening. Eliasson asserts that “It is a lot more physical; it suddenly gives a stronger sense of what it is they’re talking about when they say the Greenland ice caps are melting” (Yalcinkaya, 2018).
Fostering relationships with creative practitioners therefore becomes fundamental in how science is communicated. Gates-Stuart states that “artists are an essential part of the research process, not just in visualising information but how we understand science. Art-science research outputs often only become apparent through first-hand experience of interactions and ideas that would not happen if artists and scientists were left to their own devices” (2013). Furthermore, Mike Stubbs, ex-director of FACT – the UK’s leading organisation for the support and exhibition of art, film, and new media – agrees: “I think it’s absolutely essential that artists are part of the process not just in terms of visualising information but how we understand scientific culture” (Williams, 2017). With this in mind, an art-science hybrid may unearth further questions, methodologies, and creative possibilities as well as deepen public engagement. How can we achieve effective public engagement like Eliasson, but with the pressing issue of air pollution?
Across the world millions of premature deaths per year are associated with air pollution (Fuller et al., 2022; Vohra et al., 2021) The most dangerous air pollutant to human health is particulate matter less than 2.5 microns in diameter (PM2.5), which penetrates deep into the lungs and, in some cases, into the bloodstream (Alemany et al., 2021; Calderón-Garcidueñas et al.; 2002; Kwon, Ryu and Carlsten, 2020; Thiankhaw, Chattipakorn and Chattipakorn et al, 2022). Moreover, researchers have now made significant steps linking air pollution with early neurological decline and disease (Gardiner, 2019) and a recent study by the Francis Crick Institute in London suggests that 1 in 10 lung cancer patients in the UK is due to exposure to air pollution (BBC News, 2022). Air is a fundamental and, for the most part, invisible element that we need in order to survive, but every breath is interwoven with harmful and damaging particles. Due to the small size of these damaging airborne particulate species, drawing public attention to the issue is challenging. How do we highlight the significant health impacts of breathing dirty air but in a hopeful and proactive way to an audience?
The invisibility of air pollution suggests that it can be easily overlooked and remains low on the public’s priority list. Gardiner states: “the danger posed by pollution is slow moving and far from obvious” (2019, p20). It is here we can adopt environmentalist and literary scholar Rob Nixon’s term “slow violence” to reference a gradual, out-of-sight violence that usually occurs over years, even decades (Nixon, 2011). In the United Kingdom, the media tend to publish high levels of air pollution information from Delhi, Hong Kong, and Beijing, implying to the British public that air pollution remains a problem “over there”, and not close to home. However, the notion of “slow violence” is unfolding outside of our front doors. During the pandemic, fresh geographical evidence was used in the press showcasing how the sudden lack of transport and industry significantly reduced the smog over other cities, including London (BBC News, 2021). One survey by Global Action Plan found that “18% of all people have found it easier to breathe during the lockdown, which increases to 21% for residents of any urban area, and 36% for London residents” (House of Commons Committees, 2021). Unsurprisingly, since the pandemic, air pollution has returned to dangerous levels, with “97.3% of the world’s population who now live in areas where PM2.5 levels are unsafe” (The Guardian, 2022). Despite how alarming these statistics are, disseminating them to the public has failed to hold attention and ignite change. Perhaps the answer is how the public register air pollution in a more personal, tangible, and experiential way.
Philosopher Timothy Morton’s concept of “tuning” and the notion of rebuilding our sensuous connections with the environment, together with Jennifer Gabrys and Nerea Calvillo concept of “attuned sensing” can be considered and explored. As Morton writes, “we are sensitively attuned to everything happening in our world but end up blocking some of it out because the stimulation is too intense. Attunement is a living, dynamic relation with another being, it’s like being in a dance with something else” (Morton, 2018). In a similar vein, Jennifer Gabrys’s citizen sensing projects help to engineer significant behavioural change. Citizens within her projects have evidenced slow violence of air pollution through personal documentation and ongoing collection of air pollution data (Gabrys, 2017). By directly involving the public within her studies, Gabrys allows greater personal reflections, allows individual evidence of harm and exposure, and provides knowledge transfer and active dialogue. The exchange becomes a felt and lived experience and is more likely to have an effect on the participant. Nerea Calvillo’s project In the Air, was created for members of the public after misinformation from Madrid’s City Council, whereby air quality monitoring stations were moved without public knowledge and disseminated incorrect data. After this, the artist created a platform that the public could access for up to date and accurate information (Roberdeau, 2022).
Building on the concept of attunement, it is here we can acknowledge cycling and embodied ways of knowing as valuable methods of academic inquiry. One can also further consider the notion of attunement while cycling and if it can provide a deeper sense of ecological awareness. Shaleph O’Neill, a fellow cyclist and artist considers “representing felt experiences that the artists have had in those places and attempting to communicate something about those experiences to an audience that may recognise within them experiences of their own” (O’Neill, 2018). Despite ongoing evidence that suggests art enhances our understanding of science and data, there is still much to analyse regarding impact and personal realisation for action. Disseminating this felt and sensory experience as O’Neill highlights, and sparking the viewer’s own memories and encounters of air pollution, is what is lacking in scientific communication. The notion of attunement may help to unlock a deeper connection to the way in which we recognise poor air quality to make it more tangible and motivating. To expand, “a pungent smell when walking behind a car, a horizon tinged with a brownish colour, thick smoke that emerges from a chimney, or a throat that itches when we’re painting. Observations that we can make with our senses alone can be very useful in detecting changes in air quality” (Plume Labs, 2022).
The concept of “embodied attunement”, as further discussed by Minty Donald, “can be amplified through means such as arts practice, scientific knowledge and tools, thus allowing humans to access our connectivity within a more-than-human universe” (Donald, 2019). This art science collaboration aims to rethink our relationship with air pollution through a sensory and embodied approach.
Over a three-month period, an interdisciplinary collaboration between a conceptual artist and atmospheric scientist endeavoured to highlight air quality levels in the City of York and ways in which humans can become more receptive to it. The project investigated and visualised air pollution in areas with both adequate and poor-quality cycling infrastructure around the University of York and York St John University as well as data recorded by the artist that suggests successful attunement with air pollution. A bicycle was used as a performative tool to cycle six popular bus routes to and from both universities that offered both rural and urban landscapes. As it has been evidenced, exercise greatly increases the amount of air that we breathe in, so in turn, elevates the pollution that our lungs encounter (Gardiner, 2019, p31). Cycling is considered to be a healthy form of exercise for the body with added mental health benefits. That being said, we must also acknowledge the impacts of injury and air pollution when cycling in addition to the country’s poor cycling infrastructure, which has not yet led to any sufficient action. This is where attunement and collaboration can play an important role going forward.
Materials and methods
Adopting the method of cycling as artistic performance prompted me to engage more explicitly with artists who are engaged in similar fields of practice. In the field of performance art, Simon Starling has pursued a similar project. In September 2004, Starling crossed the Tabernas Desert in Spain also on a bicycle (Tabernas Desert Run), but one powered by compressed hydrogen (H). The only by-product of the journey was water that was collected into a cylinder on the bicycle and later used by the artist, mixed with watercolour paints, to produce a cactus painting. After the journey, the bicycle and cactus painting were showcased in an art gallery, both positioned within a glass vitrine. This work shares the concept of “journeying” by bicycle and collection from the environment (Nattress, 2021).
The author’s performance tool, a Bombtrack Beyond +1 carried a MiniVol TAS sampler housed inside a front rack basket and a Flow 2 air quality sensor attached to the handlebars. The MiniVol TAS sampler had a PM2.5 selective inlet. The sampler was operated at a flow rate of 5 L /min, with PM2.5 collected onto quartz fibre filters (Whatman, QMA, 47 mm). The Flow 2 sensor, created by Plume Labs, garnered live street level data of five pollutants; Nitrogen Dioxide (NO2), Particulate Matter PM1, PM2.5, PM10 and Volatile Organic Compounds (VOCs).
With the author’s work in mind, the process of collection and extraction were documented through the method of photography, videography, audio samples, live data collection, and note taking. The artist noted the direct and lived experience of cycling in the environment, including the smells, the weather, and how the body felt, including somatic sensations when executing each performance ride. It is here we can draw attention to Stacy Alaimo’s concept of “performances of exposure”, considering the ethical encounters of being exposed to harmful substances, chemicals, molecules in the air that may never be fully accounted for (Alaimo, 2008). A performance ride for the artist can be considered a “performance of exposure”. This is what separates a leisurely bicycle ride from a mediated performance ride, whereby the artist is knowingly collecting data and attuning to their environment. As Lorimer states, “at certain times sound recordings and video footage have emerged as effective for noticing, attuning to, and articulating the more-than-human (Lorimer, 2010).
The selected bus routes (Image 1) were chosen for several reasons, moreover, the attributed colours used within this article are the colours on bus route maps of York. The routes provided a mixture of road and cycle paths, as well as offering both quieter and more heavily congested areas. Three of the bus routes are close to the University of York and journey into the city centre through both rural and urban areas. Route 1 (pink) begins at Grimston Bar Park & Ride and travels past the University of York campus to York Railway Station via Heslington Road. This route mainly consists of road and cycle paths in traffic heavy areas. Route 2 (green) again starts at Grimston Bar Park & Ride and travels to Rougier street via Clifford Street. Route 3 (purple) also begins at Grimston Bar Park & Ride to Rougier Street but via Osbaldwick. This route takes you through the small village of Osbaldwick located about two miles east of the city closer to farmland and agriculture.
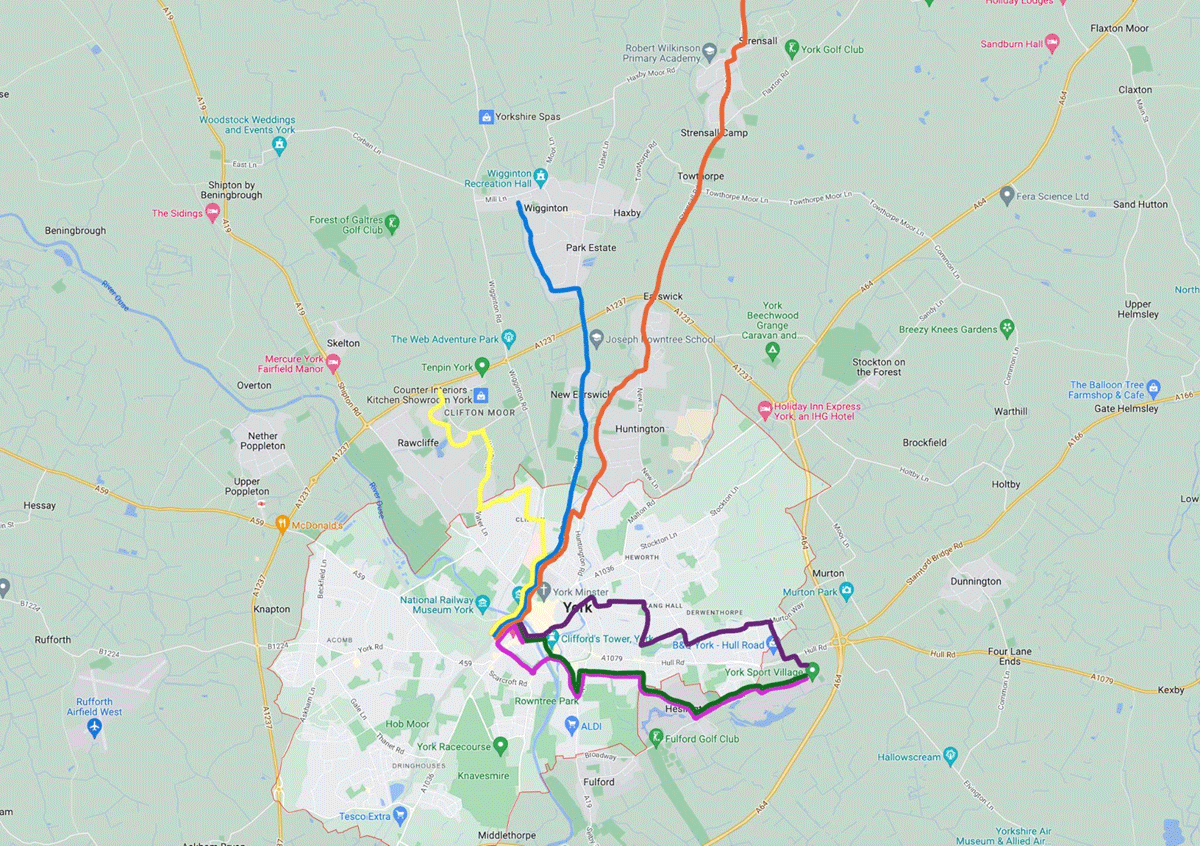
Google Maps screenshot of York and outer areas. The six colours represent the six different bus routes selected for this project.
Source: Google Maps (2022). York. Available from https://www.google.co.uk/maps/place/York/@53.9586419,-1.1156109,13z/data=!3m1!4b1!4m5!3m4!1s0x4878c340e19865f1:0x4774ab898a54e4d1!8m2!3d53.9614205!4d-1.0739108 [Accessed 22 August 2022).
The next three routes were chosen due to their links to York St John University. Route 4 (yellow) begins at Rougier Street and heads to Clifton Moor passing the university campus. This route is heavily congested due to busy roads and roundabouts with links to the outer ring road. It is predominantly road riding with some cycle paths. Route 5 (blue) begins at York Railway Station and heads four miles north of the city to Wigginton. This route is on a main road, but ventures through New Earswick which is surrounded by fields and allotments, and York St John University’s sports centre. Route 6 (orange) begins at York Railway Station and heads to Strensall which is North (but on the east side) of the city. This route travels on roads near Strensall Common, a conservation area and the army barracks facility, both of which belong to the Ministry of Defence.
Results – exhibition of artworks
The artistic responses created over this three-month collaboration were exhibited at Blossom Street Gallery in York, a gallery space that is located in a congested crossroads close to the train station. An eight-minute documentary video piece captured the collection process. The viewer could watch footage, captured by a videographer, of the artist cycling the selected bus routes over the three-month period, as well as footage from a GoPro that was attached to the handlebars. The film was interwoven with clips of nature and greenery, such as parks and rural locations that revealed high pollution readings. The documentary footage can be viewed here https://www.youtube.com/watch?v=Ut4E-aZ-Cbg.
The video piece was positioned adjacent to six discoloured filters: one from each of the bus routes housed side by side within a glass vitrine. Upon closer inspection, the filters differed in greyish colourways respective of their journey along the individual routes. These MiniVol filters were photographed and investigated under a microscope revealing interesting microscopic matter and visible colour change.
While not displayed, filters that were collected across the same route, but on different days present vastly different colourways, highlighting the high variability in local pollutant concentrations. Due to the varying route lengths, it can be noted that these filters were collected within the time frames of 3.5 to 5 hours of cycling.
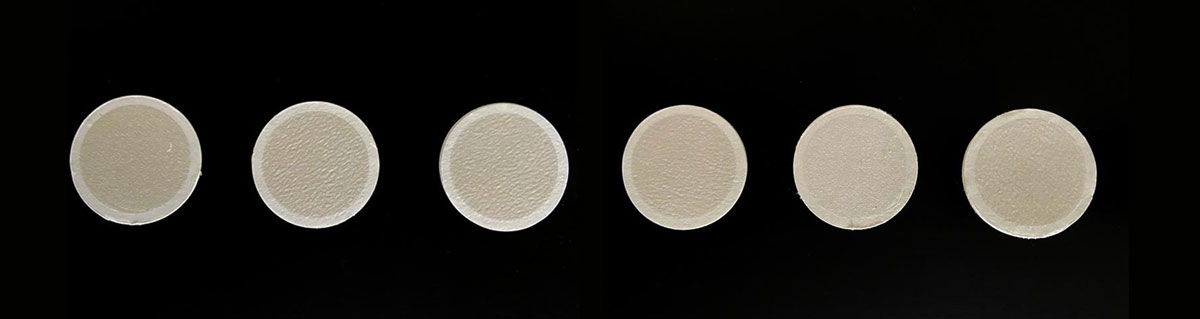
Left to right; six discoloured filters; one from each of the bus routes housed side by side. Pink, Green, Purple, Yellow, Blue and Orange.
Source: Nattress, C. (2022). Art-Science Interface: making York’s air pollution visible exhibition. Available from https://www.clarenattress.co.uk/work/the-art-science-interface. [Accessed 1 August 2022].
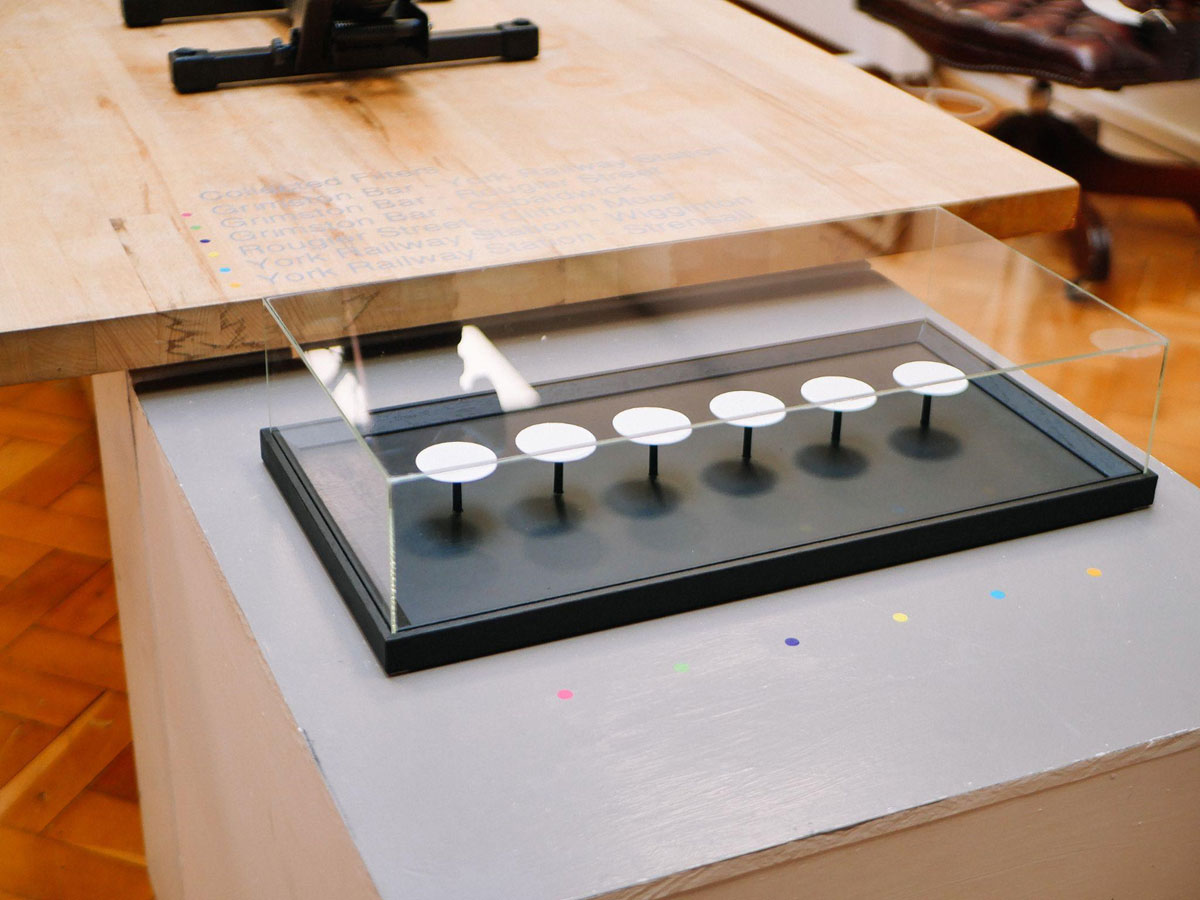
The same six quartz filters are positioned in a glass vitrine one from each of the six bus routes cycled over the three-month period: pink, green, purple, yellow, blue, and orange.
Source: Waudby, M. (2022). Art-Science Interface: making York’s air pollution visible exhibition. Available from https://www.clarenattress.co.uk/work/the-art-science-interface. [Accessed 1 August 2022].
An artist book was displayed with documentary photographs and writing about the collaboration, and the performance tool (the bicycle) was exhibited in its post-performance state, coated in visible environmental matter for the public to engage with. The artist book can be viewed here https://www.clarenattress.co.uk/work/artist-scientist-artist-book. The book’s outer sleeve is debossed with the word “Artist” with the front cover debossed with the word “Scientist”. When the book is pulled from its sleeve the two words boldly face one another. This was a nod to the nature of interdisciplinary collaboration between a practicing artist and an environmental scientist, one that is ever evolving and in motion. The chosen buckram cover and sleeve, and the G.F Smith insert pages, are textured to mirror the bicycle’s tread and the terrain under wheel. It was a purposeful design decision to use this paper stock as for over 135 years, G. F. Smith have been obsessed with the simple beauty and limitless possibilities of paper. Their desire is that “through the hands of the design community, they can bring creativity to life and constantly innovate with one of the world’s oldest materials” (G. F. Smith, 2023). The deliberate use of texture and a sliding sleeve with tactile debossed elements allowed the viewer to wield their sense of touch.
Lastly an iPad displayed a website interface that the public could interact with. The interface presents a map of York with street-level pollution data collected over the three-month period. To prevent visual confusion and route overlay, only the outbound journey of each performance ride was made visible on the map. The routes are colour co-ordinated according to the pollution levels in real time. Plume Labs base their recommendations on the WHO annual, daily, and hourly exposure guidelines, along with other global institutions, including the European Commission, the Chinese Air Quality Standards, and the United States EPA. Each of the categories of the Plume AQI indicates something specific about the length of time that you can be exposed to such pollutant rates without an adverse impact on your health, so it ensures that you can get actionable information to take real steps towards improving your own wellbeing.
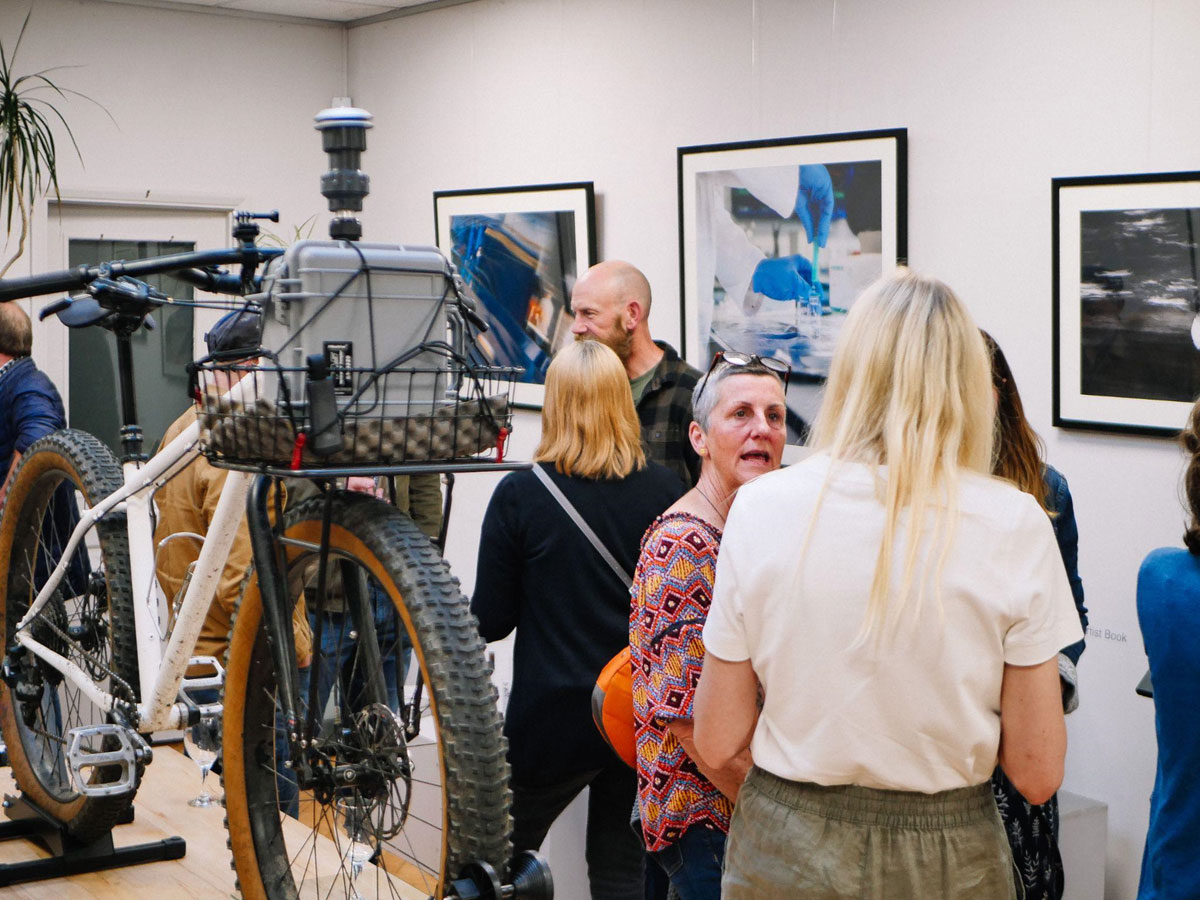
Private view of the exhibition. The bicycle is positioned on a table in the middle of the space for maximum engagement. Documentary photographs taken during performance rides and in the laboratory are curated on the surrounding walls.
Source: Waudby, M. (2022). Art-Science Interface: making York’s air pollution visible exhibition. Available from https://www.clarenattress.co.uk/work/the-art-science-interface. [Accessed 1 August 2022].
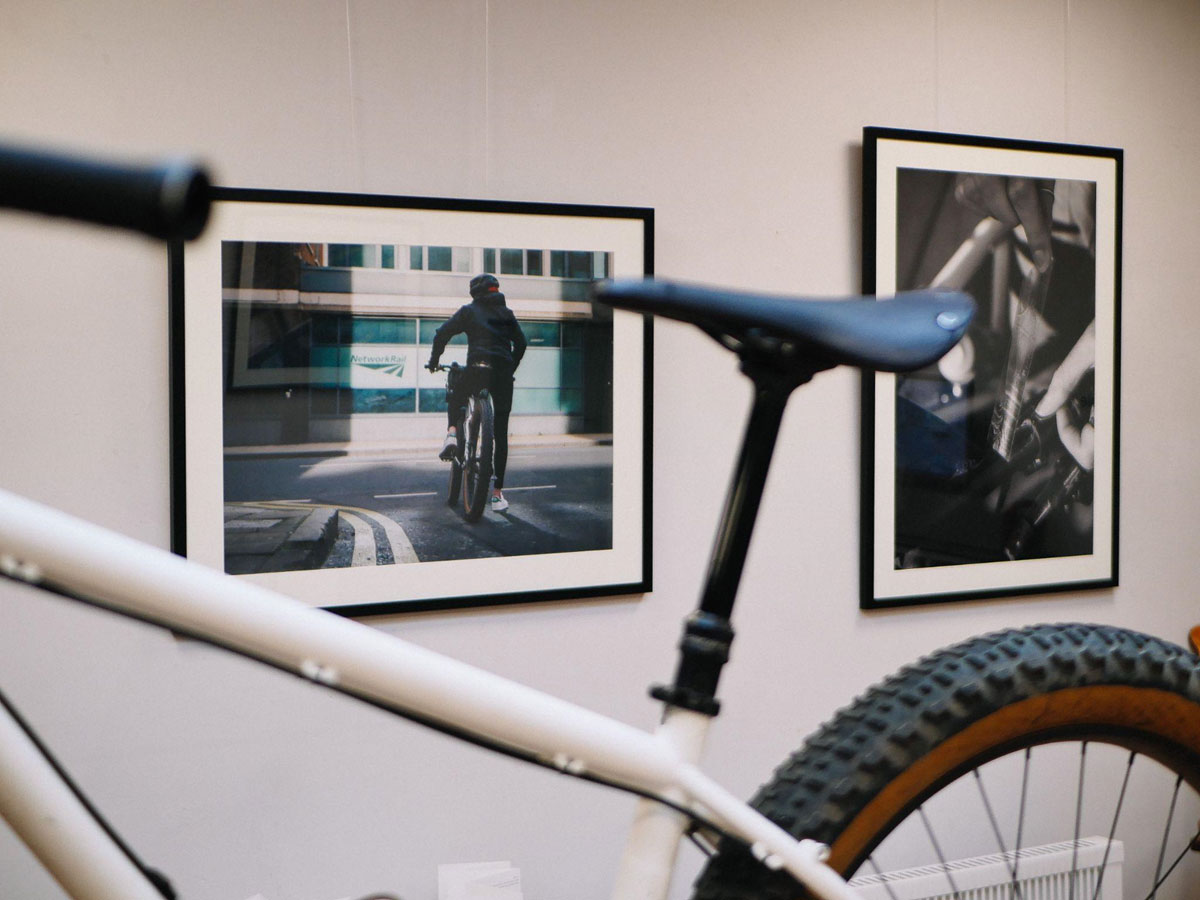
The colour green simulates low pollution in the range of 0–20. Plume Labs describes this as clean air, which is perfect for outdoor activities. Pollution levels that are highlighted green are under the recommended exposure thresholds set by the World Health Organisation (WHO) for one year of pollution exposure. The colour orange records the moderate levels 21–50 described as acceptable; however, there may be health concerns for people with specific sensitivities. Air quality is considered acceptable, though, over the recommended WHO threshold for one year. This means that, unless you have these kinds of conditions all year round, you should not be experiencing adverse health effects. However, there may be certain health concerns for people with specific sensitivities. Finally, the colour red details the higher levels 51–100. Levels between these figures suggest pollution is high and the public may start to experience more serious health effects, and those with sensitivities should take care when performing outdoor activities (Plume, 2022).
Points of interest on each of the routes were pinned with attached photography, audio samples, and GoPro video footage. The aim was not only to inform the public of high pollution street-level data, but also to communicate the embodied aspects of cycling within high levels of pollution. To share further detail, the audio samples described the scents and smells experienced throughout the rides. The pungent metal, chemical, and diesel scents were noted at the locations where they were uncovered, in addition to the familiar scents of recently mowed grass and barbecue coals. Photographs were also pinned to the interface that documented highly polluted locations along the routes, including a primary school and a public park. To reflect on the collective performance rides, a greater embodied awareness and attunement to air pollution was experienced along the green route, specifically cycling towards Rougier Street from Clifford Street, where traffic is often heavily congested. This also became apparent on the interface, often displaying this route in red, signifying high pollution levels, but also in the tangible and experiential descriptions of pollution sensed in the air through the audio samples.
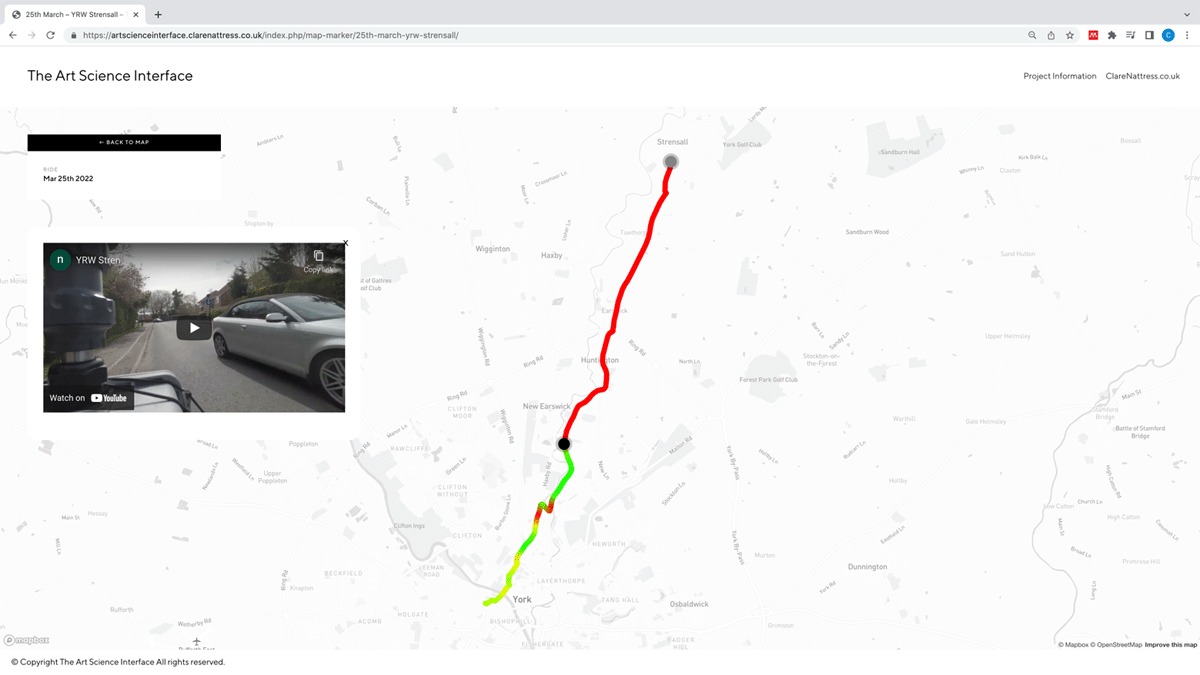
Screenshot of the interface website. A route has been clicked and has loaded individually to allow the viewer to engage with points of interest such as GoPro footage, audio clips, photography, and data. This route cycled on this day at this time has a mixture of low, moderate, and high readings.
Source: Nattress, C. (2022). The Art-Science Interface. [online platform].
The Interface became a hive of activity, an online laboratory, which detailed live data, imagery, audio, video, as well as experimentation, investigation, and process. Moreover, the footage from the GoPro helped to position the viewer into the role of the artist, observing the ride as if they themselves were sitting on the saddle of the bicycle. It was the intention that the audience was made to feel a part of the collection process during each performance ride.
This exhibition has provided initial evidence that the public actively engage with creative and visual outcomes that aim to make the invisible, visible (Nattress and Bryant, 2022). There is an increased capacity for audiences to connect kinaesthetically and interactively with embodied research. The exhibition provided a range of observations from the public. One visitor highlighted the importance of the interface for public use “I have suggested that York Council use your interface to add to their information on air pollution” (Exhibition Visitor, 2022). A second visitor stated “A very interesting variety of work with a lot to see and think about, it is very thought provoking and really engaging, especially in the city that we live in. I will walk around being more aware of my environment and air pollution” (Exhibition Visitor, 2022). Moreover, “Such an important issue to visualise to the people of York, action must be taken” (Exhibition Visitor, 2022). The feedback has provided an immediate impression that the exhibition has had a real-world benefit to a localised audience, a knowledge transfer to the public which has helped to invoke a greater sense of connectedness with the environment, and as Donald states; “accentuates a sensory and affective engagement” (2019).
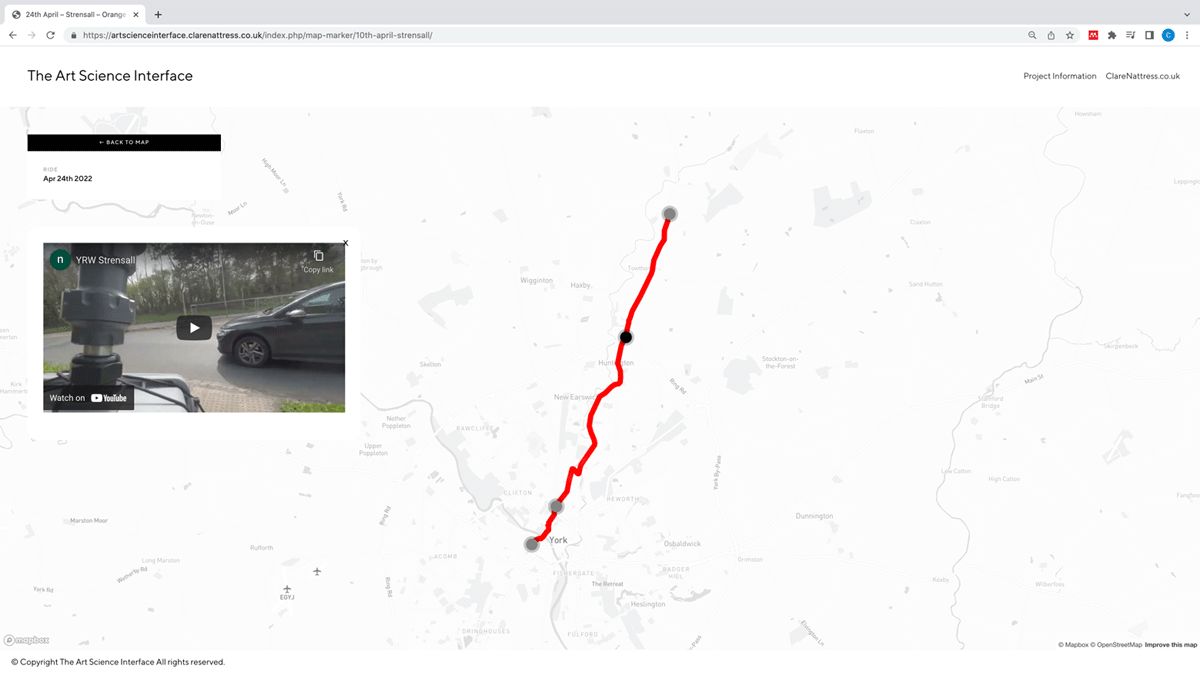
Screenshot of the interface website. A route has been clicked and has loaded individually to allow the viewer to engage with points of interest such as GoPro footage, audio clips, photography, and data. This route cycled on this day at this time has high readings.
Source: Nattress, C. (2022). The Art-Science Interface. [online platform].
It was also interesting to observe how the public interacted with the artist and scientist during the private view. Having the scientist present at the opening event proved fruitful as the audience felt comfortable to engage in conversation and discuss the artworks and the data on display. Together, the artist and scientist could talk openly about the importance of this collaboration, but also elucidate their own processes, creative outcomes, and laboratory data and terminology in more detail. With visual artworks as key discussion points, these conversations proved to be worthwhile and fundamental for knowledge transfer, particularly in sharing the affordable and wearable air pollution technology that can help to lower everyday exposure.
Results – data summary
There has been a recent boom in cheap, wearable commercially available air quality sensors, allowing the user to directly observe the air quality around them and make informed decisions about their route(s) to work. The Flow 2 sensor (https://plumelabs.com/en/flow/) used in this study has been previously tested both in laboratory and field settings, with a high correlation between sensors as well as to reference instruments for some pollutants but more limited for others. However, although sensors can generally observe air pollution events, the accuracy of the sensors is limited (Kang et al., 2022; Karagulian et al., 2022; Plume Labs Flow 2, 2022). Crnosija et al. (2022) found that the overall accuracy of the average of 32 Flow 2 devices for PM10 measurements was 380.59% and that of the PM2.5 measurements was 433.72%; however, they had moderate correlation values of 0.52 and 0.76, respectively. NO2 concentrations were evaluated by the Air Quality Sensor Performance Evaluation Centre and found high correlations between the sensor and reference instrument for PM, but very limited correlations were observed for NO2 (Plume Labs 2, 2022).
Overall, sensors provide an insight into air pollution events for a relatively low cost, but at limited accuracy. The Flow 2 sensor gave measurements of PM1, PM2.5, PM10, NO2 and VOC concentrations as well as putting these concentrations into context via an air quality index (AQI). This AQI runs from low (0–20) highlighting adequate air quality, to 250 + which is extreme air pollution affecting everyone (What is an air quality Index (AQI)?, 2022).
Pollutant concentrations that were measured, for this study, via the Flow 2 sensor were collected over 32 rides across 6 routes throughout the city of York (Figure 1). The lengths of each performance ride ranged from 3.5–5 hours of cycling (Table 1). Table 1 provides the mean ± SD for all 32 rides, while Table 1 highlights the mean ± SD of the different pollutant concentrations and AQIs averaged across the six routes.
Mean ± standard deviation for the different pollutants and their related AQI values across the different routes. The values are averaged over all rides (n) along each route. Table 1 is also useful to demonstrate the significant contrasts between scientific and artistic methods of communication, reaffirming how artistic methods are crucial in order to improve engagement in the issue.
| Route | n | NO2 (ppb) | NO2 (Plume AQI) | PM1 (μg/m-3) | PM1 (Plume AQI) | PM2.5 (μg/m-3) | PM2.5 (Plume AQI) | PM10 (μg/m-3) | PM10 (Plume AQI) | VOC (ppb) | VOC (Plume AQI) |
|---|---|---|---|---|---|---|---|---|---|---|---|
| Purple | 7 | 68.2 ± 98.3 | 54.5 ± 61.3 | 1.9 ± 2.6 | 5 ± 6.4 | 5.1 ± 4.5 | 10.1 ± 8.9 | 32.8 ± 34.1 | 35.1 ± 37.7 | 38.9 ± 16.6 | 3.1 ± 1.4 |
| Green | 7 | 276.8 ± 183.4 | 171.3 ± 98.4 | 1 ± 0.2 | 3.1 ± 0.5 | 2.7 ± 1.3 | 5.4 ± 2.6 | 18.2 ± 20.8 | 19.2 ± 23.5 | 17.7 ± 10.2 | 1.5 ± 0.8 |
| Pink | 8 | 124.9 ± 143 | 89.5 ± 81.6 | 1.1 ± 0.8 | 3.3 ± 1.9 | 2.7 ± 2.3 | 5.5 ± 4.6 | 15.4 ± 22.9 | 16 ± 25 | 50.6 ± 44.7 | 4.1 ± 3.6 |
| Yellow | 2 | 48.6 ± 6.1 | 54.6 ± 5 | 1.2 ± 1.7 | 3.5 ± 4.1 | 2.3 ± 2 | 4.6 ± 4 | 8.4 ± 9.7 | 8.4 ± 9.6 | 44.3 ± 8 | 3.5 ± 0.7 |
| Blue | 4 | 41.4 ± 14 | 45.7 ± 15.7 | 1.1 ± 0.3 | 3.2 ± 0.6 | 3.5 ± 2.4 | 7.1 ± 4.9 | 22 ± 31.9 | 23 ± 33.9 | 30.2 ± 7.5 | 2.4 ± 0.7 |
| Orange | 4 | 44.1 ± 23.9 | 48 ± 24.7 | 1 ± 0.2 | 3.1 ± 0.3 | 2.7 ± 1.5 | 5.5 ± 3 | 15.2 ± 21.8 | 15.9 ± 24.3 | 21.3 ± 8.1 | 1.7 ± 0.7 |
For further insight, PM is produced from a range of primary and secondary sources, with different sources dominating different size ranges. Larger particles, such as PM10 are usually comprised of primary, inorganic species originating from combustion processes, construction, and road transport as well as natural sources such as sand and sea salt. PM2.5 and PM1 species are a more complicated mix of primary and secondary inorganic and organic species. Primary sources include exhaust emissions, cooking, and industrial processes, while secondary processing of volatile organic compounds (VOCs) from a range of anthropogenic and biogenic sources leads to significant PM formation across urban and rural areas.
Average PM1 and PM2.5 concentrations across the different routes were low, ranging from 1 ± 0.2 μg m-3 for PM1 across the orange and green routes, and up to 5.1 ± 4.5 μg m-3 for PM2.5 across the purple route. All routes for PM1 and PM2.5 were designated as low AQI. Higher PM10 concentrations were observed across the six routes than PM1 and PM2.5. PM10 sources within the environments cycled are likely dominated by road, construction, and agricultural dust. On average the purple route had the highest PM10 concentrations (32.8 ± 34.1 μg m-3) of any of the routes. The purple route passed through several industrial areas, which are likely sources of PM10. The yellow route had the lowest average PM10 concentrations (8.4 ± 9.7 μg m-3), with the route passing through more suburban areas. It should be noted however that this route was only cycled twice, so is not as representative as the other routes. Only two routes, purple and blue, were deemed to be moderate in terms of the AQI, with the other routes low.
VOCs comprise of a large and highly diverse group of species, emitted from a range of biogenic and anthropogenic sources. VOCs are produced from combustion processes, cooking, cleaning, and personal care products, as well as natural sources such as flora. Average VOC concentrations ranged from 17.7 ± 10.2 ppb to 50.6 ± 44.7 ppb for the green and pink routes respectively, however all routes had AQI’s less than 5 (low).
NO2 is a gaseous pollutant, generally produced from the combustion of fossil fuels, especially diesel in urban environments. The average NO2 concentrations ranged from 41.4 ± 14 ppb along the blue route, to 276.8 ± 183.4 ppb along the green route. The NO2 AQI range was generally “high”, meaning that everyone may start to experience more serious health effects, especially in the long term. The green route was classified as “excessive”, suggesting the effects will be felt immediately, healthy individuals may show symptoms of short-term exposure. The green route is one of the main bus routes from the city centre to the University of York and is heavily used by commuting traffic. A greater embodied awareness and attunement to air pollution was experienced on the green route, shared by the artist through audio, video and notes attached to the interface. Overall, NO2 was observed to be the most important pollutant in terms of contributing to poor air quality. High NO2 concentrations are likely observed due to close proximity of the artist to combustion engine exhausts.
Discussion – benefits of interdisciplinary collaboration for public engagement
This interdisciplinary collaboration, despite being in its infancy, has provided a wealth of knowledge regarding public engagement and effective methods of dissemination. It is clear by the comments received from the exhibition that audiences were more engaged by the interface, filter samples, and the exchange in dialogue. These creative outcomes were successful in making the invisible, visible but also helped to deepen our understanding of non-human collaborators in a sensory and embodied way and encourage dialogue on the issue. The direct access to an audience meant that dialogue was tailored to the individual or group allowing for greater engagement and understanding. This would be a significant pathway to impact. Air pollution that the viewer could see, and/or connect with, provides the artist and scientist with a considerable scope for development. It is clear that interdisciplinary practice is fundamental in arts science disciplines to provide energy, new insights and to encourage personal action. Interdisciplinary approaches are crucial to combat pressing environmental concerns, working together is the only solution.
The overall aim of science is to positively impact the public; however, science research is generally published in journals which are only, more recently, becoming fully open access allowing for greater transparency with the public. However, making this work accessible for a range of audiences is challenging. This is just one hurdle of disseminating research to the public and engaging them in environmental issues such as air pollution and climate change. When scientists promote their work which has been published, they tend to do so at workshops or conferences which are attended by other scientists within their field, with a high level of background expertise and understanding of the environmental concern. The exhibition, however, aimed to provide an approachable environment to engage members of the public more directly and emotionally.
Overall, in this case an art-science collaboration engineered two key outcomes in terms of research outputs. Firstly, a collaboration between an artist and scientist meant seeing the environmental issue of air pollution from completely different angles. This engagement allowed for a unique knowledge exchange between the artist and scientist from two very different perspectives, but with a shared common goal. This included the use of varying terminology, championing embodied ways of knowing as opposed to scientific data analysis, audience engagement strategies and methods of dissemination.
Secondly, this collaboration has broadened perspectives on what types of outcomes are more impactful and engaging. For a broad public audience, high level complex analysis may not be necessary to promote engagement with this pressing environmental issue. The collection of particulates onto filters provided a stark visual of what York’s residents were breathing every day, in what may seem a relatively clean environment.
Conclusion
Despite a short period of time to join forces, significant benefits of interdisciplinary collaboration have been uncovered. Together the artist and scientist have delivered a paper at the European Geosciences Union General Assembly in Vienna (https://meetingorganizer.copernicus.org/EGU22/EGU22-5038.html) in what can be described as a more traditional mode of disseminating research, as well as curating an art exhibition of work from this project. There is an acknowledgement that both methods of dissemination have been crucial to engage scientists, artists, and the cycling community to comprehend the issue of air pollution. However, it is clear that as our collaboration evolves it will be necessary to engage with the broader public, in particular outside of a traditional white cube gallery space to increase our reach and influence and help to disseminate the issue. It is here we can revert to Olafur Eliasson’s successful method of public display and embed this into our continuing collaboration. It can also be reiterated that the human body is a credible and necessary site for research enquiry. Embodied and sensorial ways of knowing will be expanded upon and will be central to this enquiry going forward. We can continue to consider and explore how does the communication of felt experience of air pollution complement and perhaps challenge scientific methods.
It is through the research that has been undertaken that one can also recognise the importance of a wider validity of data collection and the need to cover additional ground with greater consistency. This is where participatory cyclists may be fundamental to the developing research. Participants will enable an increase in sensors, and in turn an abundance of data, as well as personal experiences of embodied attunement, valued dialogue, and exchange. It would also be insightful to gather further evidence of engagement through discussion groups and feedback opportunities to increase robustness.
Acknowledgements
The authors would like to thank Professor Jacqui Hamilton, University of York for her guidance throughout the project. The project was funded by NERC Discipline Hopping for Environmental Solutions, awarded in 2021.
Competing Interests
The authors have no competing interests to declare.
References
1 Alemany, S, et al. 2021. Associations between air pollution and biomarkers of Alzheimer’s disease in cognitively unimpaired individuals. Environment International, 157: 106864. DOI: http://doi.org/10.1016/j.envint.2021.106864
2 BBC News. 2021. Then and now: pandemic clears the air. [online] Available from https://www.bbc.co.uk/news/science-environment-57149747 [Accessed 6 July 2022].
3 BBC News. 2022. Air pollution cancer breakthrough will rewrite the rules. [online] Available from https://www.bbc.co.uk/news/health-62797777 [Accessed 11 September 2022].
4 Calderón-Garcidueñas, L, et al. 2002. Air pollution and brain damage. Toxicologic Pathology, 30(3): 373–389. DOI: http://doi.org/10.1080/01926230252929954
5 Crnosija, N, et al. 2022. Laboratory chamber evaluation of flow air quality sensor PM2.5 and PM10 measurements. International Journal of Environmental Research and Public Health 2022, 19(12): 7340. DOI: http://doi.org/10.3390/ijerph19127340
6 Donald, M. 2019. Guddling about: an ecological performance practice with water and other nonhuman collaborators. GeoHumanities, 5(2): 591–69. DOI: http://doi.org/10.1080/2373566X.2019.1652106
7 Fuller, R, et al. 2022. Pollution and health: a progress update. The Lancet Planetary Health, 6(6): e535–e547. DOI: http://doi.org/10.1016/S2542-5196(22)00090-0
8 Gabrys, J. 2017. Citizen sensing, air pollution and fracking: from “caring about your air” to speculative practices of evidencing harm. In: Singleton, V, Gill, N and Waterton, C. (eds.) Care and Policy Practices. The Sociological Review, 65(2): 172–92. DOI: http://doi.org/10.1177/0081176917710421
9 Gardiner, B. 2019. Choked. The age of air pollution and the fight for a cleaner future. London: Granter Books. DOI: http://doi.org/10.7208/chicago/9780226630793.001.0001
10 Gates-Stuart, E. 2013. Art and science as creative catalysts. Available from https://direct.mit.edu/leon/article-abstract/49/5/452/46121/Art-and-Science-as-Creative-Catalysts?redirectedFrom=fulltext. [Accessed 15 June 2022]. DOI: http://doi.org/10.1162/LEON_a_01065
11 House of Commons Committees. 2021. The Government must improve air quality in the UK. [online] Available from https://ukparliament.shorthandstories.com/pandemic-air-quality-EFRA-report/index.html. [Accessed 10 June 2022].
12 Kang, Y, et al. 2022. Performance evaluation of low-cost air quality sensors: A review. Science of The Total Environment, 818: 151769. DOI: http://doi.org/10.1016/j.scitotenv.2021.151769
13 Kwon, HS, Ryu, MH and Carlsten, C. 2020. Ultrafine particles: unique physicochemical properties relevant to health and disease. Experimental and Molecular Medicine, 318–328. Springer Nature. DOI: http://doi.org/10.1038/s12276-020-0405-1
14 Lorimer, H. 2010. Moving image methodologies for more-than-human geographies. Cultural Geographies, 17(2): 237–258. DOI: http://doi.org/10.1177/1474474010363853
15 Morton, T. 2018. All art is ecological. Great Britain: Penguin Books.
16 Nixon, R. 2011. Slow violence and the environmentalism of the poor. Cambridge, MA: Harvard University Press. DOI: http://doi.org/10.4159/harvard.9780674061194
17 O’Neill, S. 2018. Self-tracking cycling data as representations of landscape. Journal of Visual Art Practice, 18(2): 163. DOI: http://doi.org/10.1080/14702029.2019.1587667
18 Plume Labs – Flow 2. Available from http://www.aqmd.gov/aq-spec/sensordetail/plume-labs---flow-2 [Accessed 20 October 2022].
19 Roberdeau, W. 2022. Counter-attacking pollution in three aerial acts. Performance Research on Air, 26(7): 23–30. DOI: http://doi.org/10.1080/13528165.2021.2059278
20 Roughley, M, Smith, K and Wilkinson, C. 2019. Investigating new areas of art-science practice-based research with the MA Art in Science programme at Liverpool School of Art and Design. Higher Education Pedagogies, 4(1): 226–243. DOI: http://doi.org/10.1080/23752696.2019.1583072
21 The Guardian. 2022. Air pollution got worse during lockdown in many countries, study finds. [online] Available from https://www.theguardian.com/environment/2022/jun/14/air-pollution-got-worse-during-lockdown-in-many-countries-study-finds?utm_term=Autofeed&CMP=twt_gu&utm_medium&utm_source=Twitter. [Accessed 13 July 2022].
22 Thiankhaw, K, Chattipakorn, N and Chattipakorn, SC. 2022. PM2.5 exposure in association with AD-related neuropathology and cognitive outcomes. Environmental Pollution, 292: 118320. DOI: http://doi.org/10.1016/j.envpol.2021.118320
23 Vohra, K, et al. 2021. Global mortality from outdoor fine particle pollution generated by fossil fuel combustion: results from GEOS-Chem. Environmental Research, 195: 110754. DOI: http://doi.org/10.1016/j.envres.2021.110754
24 Williams, G. 2017. Are artists the new interpreters of scientific innovation. Available from https://www.nytimes.com/2017/09/12/t-magazine/art/artist-residency-science.html. [Accessed 20 June 2022].
25 What is an Air Quality Index (AQI)? Available from https://air.plumelabs.com/learn/en/what-is-an-aqi [Accessed 20 October 2022].
26 Yalcinkaya, G. 2018. Olafur Eliasson instals giant blocks of glacial ice across London. Available from https://www.dezeen.com/2018/12/12/ice-watch-olafur-eliasson-installation/. [Accessed 8 June 2022].