Introduction
This paper sets out to assess the impact of restrictions related to COVID-19 on levels of cycling in Scotland during and after the first COVID-19 lockdown (starting in March 2020) using data from networks of automatic monitors situated around Scotland. We also seek to distinguish impacts related to COVID-19 from impacts from other factors, most notably the weather. The population-level restrictions implemented in response to the pandemic have had a dramatic effect on both levels of travel and modes of travel used. Prior to the pandemic, there had been a gradual but modest shift toward more home working (Felstead, 2012; Transport Scotland, 2020d), virtual meetings and less commuting (Department for Transport, 2017), which COVID restrictions have accelerated. At least some of these changes may persist, in some form, in the longer term. Understanding these patterns will help us better plan travel services and transport investment as national and local governments try to “build back better” while addressing the concomitant challenges of reducing carbon emissions and transport-related pollution.
Scottish context
Scotland is a country of 5.4 million people within the UK and has a devolved government which controls most aspects of transport, health and environmental policy. Increasing everyday walking and cycling in Scotland is seen as playing an important part in creating an active and sustainable transport system (Transport Scotland, 2014; Transport Scotland, 2020c); improving population health (Scottish Government, 2018); reducing air pollution (Scottish Government, 2020b); achieving Scotland’s challenging climate change targets (Scottish Parliament, 2019); and in regenerating cities and town centres (Scottish Government, 2019). The co-benefits of making the shift to sustainable transport are broadly recognised (Davis and Whyte, 2020). In recent years, investment in active travel in Scotland has risen substantially, increasing from £39 million in 2017–2018 to £100 million in 2020–2021 (Scottish Government, 2020a). The latest Scottish Government commitment is to treble the active travel budget to at least £320 million by 2024–2025, a figure which will represent 10% of the total transport budget (Scottish Government, 2021).
Active travel trends
Despite these commitments to active travel and increased spending on public transport, car use predominates for most journeys in Scotland, and relatively few people choose to walk and cycle. In 2011, the rate of commuting to work by bicycle in England was double that in Scotland (3.2% versus 1.6%, respectively) (Office for National Statistics, 2014; Davis and Whyte, 2020). Within Scotland, cycle commuting rates are generally higher in cities than in rural areas (Baker et al., 2021), but cycling rates in Scottish cities are lower than in many comparable European cities (Warren, 2010). In the period 1966–2011, car commuters rose from 21% to 69% of all commuters in Scotland, commuters by bus and on foot both more than halved, and cycling commuters remained low, representing less than 2% of all commuters (Davis and Whyte, 2020). More recently, these trends have continued: the proportion of all journeys made where walking was the main mode reduced from 26% to 22.1% between 2012 and 2019, while cycling journeys as a proportion of all journeys have remained low (1.2% in 2019) (Transport Scotland, 2020d), representing only 2.7% of all journeys to work by employed adults not working from home in 2019 (Transport Scotland, 2020d). Despite the rural nature of much of Scotland, the majority of the population live in urban areas, and a high proportion of trips are over short distances; 41% of all trips in Scotland in 2018 were under 3 km and therefore could potentially have been cycled. However, the reality is different; 34% of journeys less than 1 km were made by car or van in 2018 (Transport Scotland, 2019). There are wide inequalities in access to a bicycle in Scotland, which increases with household income and household size; 62% of households with an income of £50,000 or more have access to one or more bikes, compared to 19% of households with an income up to £10,000 (Transport Scotland, 2020d).
COVID-19
Coronavirus (COVID-19) was first reported at the end of 2019 in Wuhan, China, and spread rapidly to Europe in the first quarter of 2020. On March 11, the World Health Organization (WHO) announced that the outbreak was a global pandemic (Boseley, 2020). In the UK, restrictions on work and social movement started to be imposed from mid-March onwards. In Scotland, mass gatherings (of 500 or more people) were banned from Monday, March 16, onwards, and organisations started advising staff to work from home. Schools, restaurants, pubs and cafes were told to close on Friday, March 20.
On Monday, March 23, further restrictions were announced, and people were advised to work from home, to stay at home except for essential trips out to shops or for exercise, to keep two metres distant from other people when out of doors and to self-isolate if they or someone in their household had COVID-19 symptoms. Contact with family and friends was restricted, travel was limited to local areas, public transport services and capacity were reduced, many shops and services closed and daily exercise outside was limited to walking or cycling locally (Scottish Government, 2020c).
Public attitude survey data collected in May 2020 in Scotland confirmed that COVID work and travel restrictions had altered travel behaviours; 62% of adults said they were driving less since lockdown restrictions came into effect, and 9% were walking or wheeling more than they did prior to lockdown (Transport Scotland, 2020a). Concerns about the risks of contracting or spreading the virus while using public transport were evident, and nearly half of respondents said they would avoid public transport once restrictions were lifted (Transport Scotland, 2020a). Six out of ten respondents stated that they would walk and cycle more when restrictions on transport were lifted. Government estimates of vehicle use trends in the UK and Scotland provide a more nuanced picture: while car use did fall initially, it picked up again and was close to pre-lockdown levels by mid-August 2020. In contrast, rail use was only at 25%–30% of pre-lockdown levels by mid-August, and bus use was at 30%–40% of pre-lockdown levels (Department for Transport, 2020; Transport Scotland, 2021).
Evidence from England suggests that cycling for leisure and sport increased between mid-March and mid-May 2020, as did walking for leisure (marginally), while walking and cycling for travel was markedly reduced. Overall, physical activity levels among adults fell in this period in England (Sport England, 2020). In Scotland, there was some evidence that walking on leisure routes increased during lockdown (Garnham, 2020), and Cycling Scotland reported that between March and August 2020, 43% more cycling journeys were recorded compared to the same period in 2019 (Cycling Scotland, 2020).
De Vos (2020) has speculated that COVID restrictions, including the need for social distancing, would reduce travel demand and participation in activities, leading to social isolation and negative effects on well-being. In this context, he has pointed to the importance of walking and cycling for maintaining good health and well-being and for reducing the risk of increased obesity. Others have noted that COVID-19 provides an opportunity to reset our transport system, which is over-reliant on polluting and dangerous travel modes, by investing in walking and cycling while discouraging car use (Laverty et al., 2020). In Scotland, a practical example of this is the Spaces for People programme (Sustrans, 2020), which was set up early in the pandemic period to fund temporary infrastructure to ensure safe and socially distanced active travel. The scheme funded local 20 mph speed restrictions, road closures (to motorised vehicles) and the building of temporary segregated cycle and walking paths on roadways. Despite this investment, and with fewer people commuting to work, car traffic in Scotland had risen back to 85% of pre-lockdown levels by mid-August 2020, perhaps in part due to people avoiding public transport—and reduced services—and people turning to the car for longer journeys (Transport Scotland, 2021).
There are questions about both the short- and long-term impacts of COVID on travel patterns and about the sustainability of our current transport systems. Our study sets out to explore the impact of COVID-19 restrictions on cycling levels across Scotland, from the start of the first two-month lockdown beginning in March 2020 and during the subsequent easing of restrictions up to mid-August 2020. To do this, we collected and analysed data from a growing network of automatic cycle counters across Scotland.
Aims and research questions
The overarching aim of this study is to describe, analyse and interpret changing trends in cycling in Scotland that resulted from the COVID-19 pandemic and related restrictions during the first “lockdown” phase from March 23, 2020, through to mid-summer 2020.
The following research questions are addressed:
RQ1: How did cycling levels change in the period from March to mid-August 2020?
RQ2: What level of change in cycling volumes over this period can be attributed to the pandemic, after adjusting for weather and other factors?
RQ3: Do patterns of cycling vary according to the type of route, that is, commuting, leisure or mixed?
Methodology
Setting and data sources
This study primarily utilises data from cycle counters situated in urban and rural areas across Scotland. The counter data was accessed from a range of organisations that support and promote active travel. Data from 60 counter sites came from the National Monitoring Framework dataset available on an open data portal maintained by Cycling Scotland (https://usmart.io/org/cyclingscotland/). Scottish Canals provided data from a further 52 cycle counters located on paths adjacent to four canals situated in central Scotland, Argyll and the Highlands: the Caledonian Canal, the Crinan Canal, the Union Canal and the Forth and Clyde Canal. Sustrans provided data from 10 counters covering three local authority areas (North Ayrshire, Aberdeen City and Edinburgh). Data from a further 43 counters in Glasgow were downloaded from a pilot open data hub set up by Glasgow City Council (https://gcc.developer.azure-api.net/api-details#api=mobility&operation=get-mobility-measurements). Most of these cycle counters use an induction loop recording system. Overall, the counters from these sources cover 22 of the 32 local authorities in Scotland.
The cycle counter data was supplemented by data on cycle journeys made through the City of Edinburgh’s Just Eat bike hire scheme, provided via an open data portal. (This data is no longer available, since the scheme permanently closed down in September 2021.) The scheme offered pedal and electric bikes for hire from over 100 public stations across Edinburgh. Membership of the scheme was open to the public, and hire fees started from £1.50 for the first hour of pedal bike hire.
Data
Overall, cycle counter data was obtained from 165 sites across Scotland. Some counters had been in use from the beginning of 2018, while others started operating at different points in 2019. To maximise coverage of Scotland, data were selected over the period January 1, 2019, to mid-August 2020.
Prior to carrying out the descriptive analysis, counter sites were excluded if, in the period March to mid-August 2020, counter malfunctions led to zero or null counts for two days or longer—in some cases the gap was weeks or months—or if the counter displayed erratic very high or very low count values in comparison to previous data from that counter. As a result, data from 71 counters had to be omitted, leaving useable data from 94 counters spread across 20 local authorities in Scotland for this analysis (Figure 1). Some counters provided hourly counts, while others only provided daily counts. To provide consistency, all data were aggregated to daily counts in the final analysis dataset.
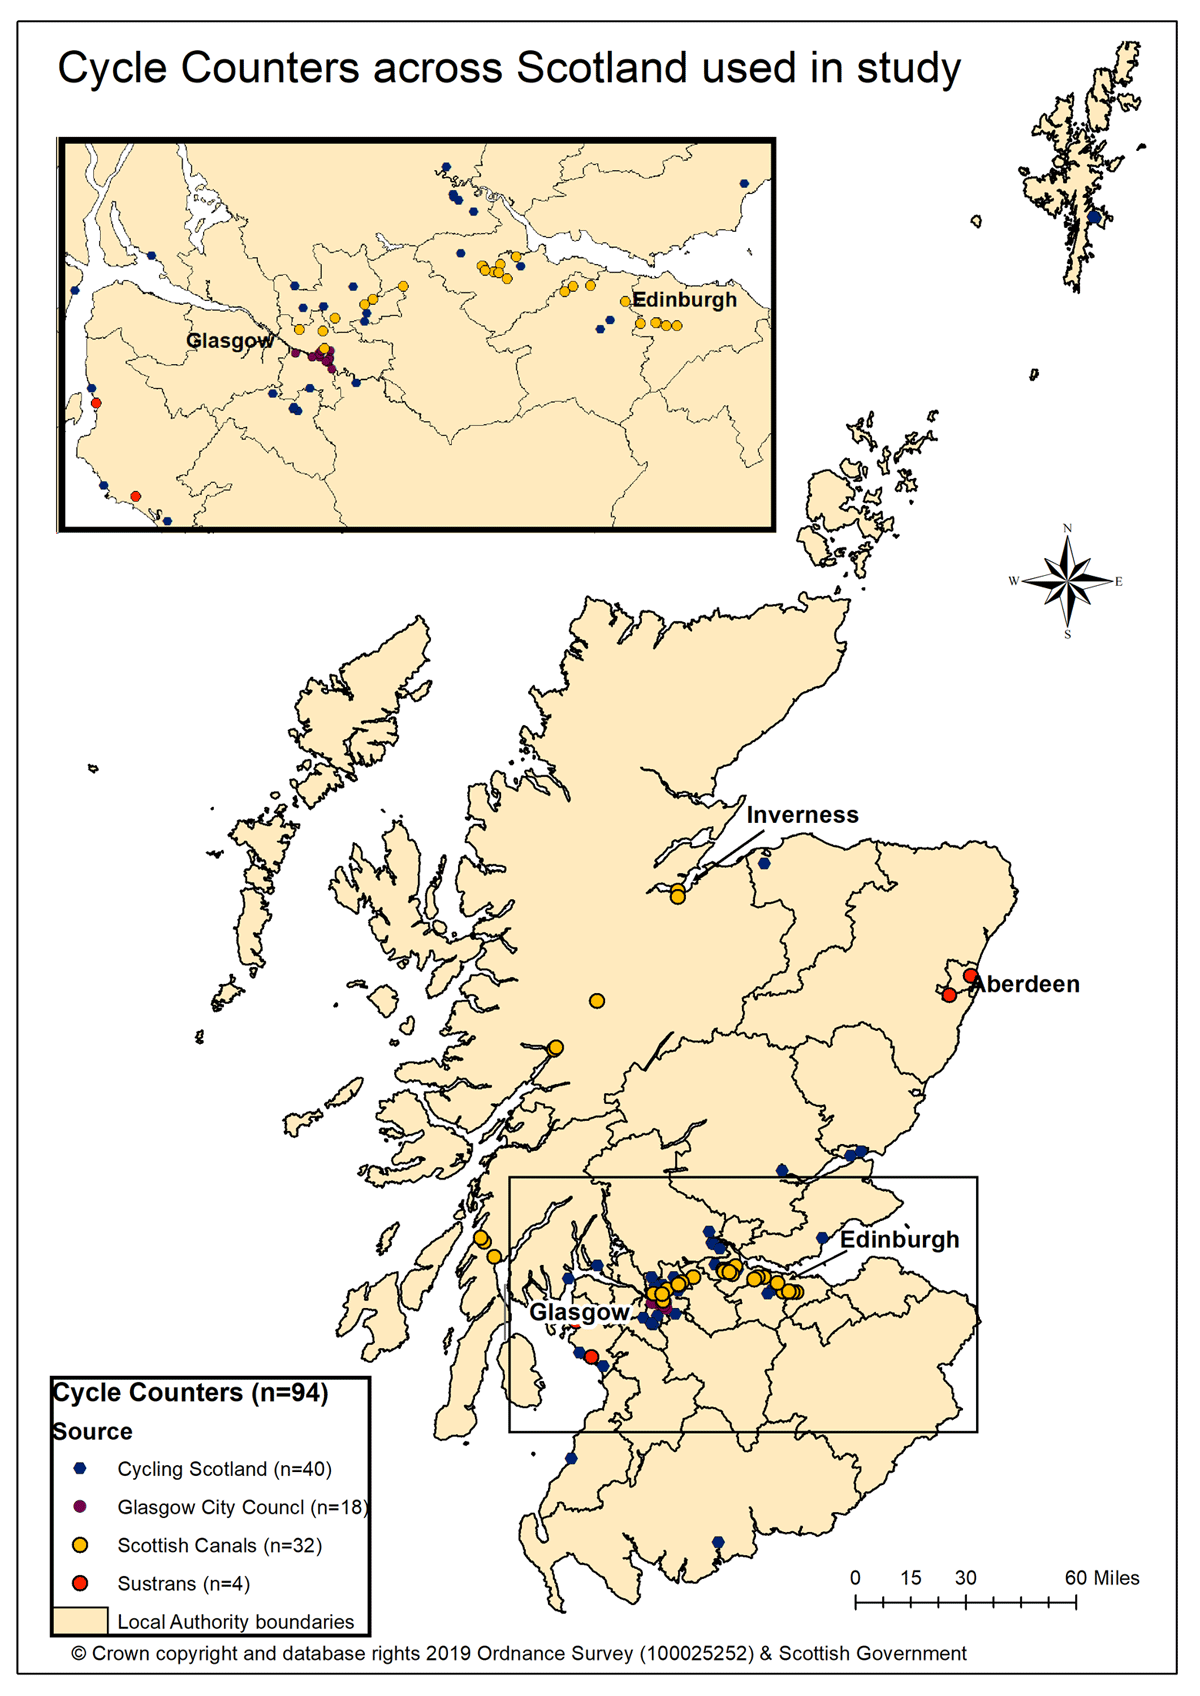
Map of cycle counters across Scotland used in study. Selected cities and local authority boundaries shown.
The impact of COVID restrictions may have affected cycling volumes differently, depending on whether the predominant trip purpose was commuting or leisure. While we do not have information on individual trips, we can infer something about the typical type of journey made at each counter location based on the temporal pre-COVID traffic pattern. We devised a methodology for categorising counters to distinguish predominantly commuting routes from predominantly leisure routes; those that did not fit either of these criteria were designated as mixed.
Specifically, the criteria applied were based on weekly usage patterns from 2019 to represent the pre-pandemic use of each route (use is likely to have changed during the period of the pandemic restrictions from mid-March 2020 onwards). A route was classed as a commuting route if the cycle count dropped by at least 10% over a weekend compared to the weekly average for that site. If the cycle count rose by at least 10% compared to the weekly average on either Saturday or Sunday, the route was defined as a leisure route. Routes which met neither criteria were defined as mixed. These are broad categorisations based on limited information, and it is likely that there were leisure cyclists on the commuting routes and vice versa (the former is even more likely during lockdown). The final analysis dataset of 94 counter sites comprised 35 commuting routes, 16 mixed routes and 43 leisure routes.
Data on weather conditions was taken from the Integrated Surface Database (ISD) administered by the National Oceanic and Atmospheric Administration (NOAA). It was collected using the Worldmet package (Carslaw, 2020) in R (R Core Team, 2020). For each cycling counter location, the nearest appropriate weather station was used. Data on the sunrise and sunset times each day at each cycle count location were calculated using the Suncalc package (Thieurmel and Elmarhraoui, 2019) in R. A new variable, daylight, was calculated by taking the difference between these times.
Data on bike hire journeys in Edinburgh was provided through an open data portal as a cleaned dataset, which excluded journeys of less than one-minute duration, cancelled journeys and administrative bike moves.1 We compiled data on journeys made through the scheme between March and August 2020 and classified them into two categories: roundtrips, where the hire bike was returned to the same station from which it was hired, and one-way, where the hire bike was returned to a different station. Roundtrips were used as a proxy for leisure cycling, and one-way journeys as a proxy for trips that involved commuting from one location to another.
Summary of COVID-19 travel related-restrictions and their timing
Lockdown measures were introduced on March 23, 2020. A summary of restrictions relevant to getting around during lockdown and in subsequent Phases 1–3 of the easing of restrictions can be found in Figure 2 and in more detail elsewhere (Teuton et al., 2020).
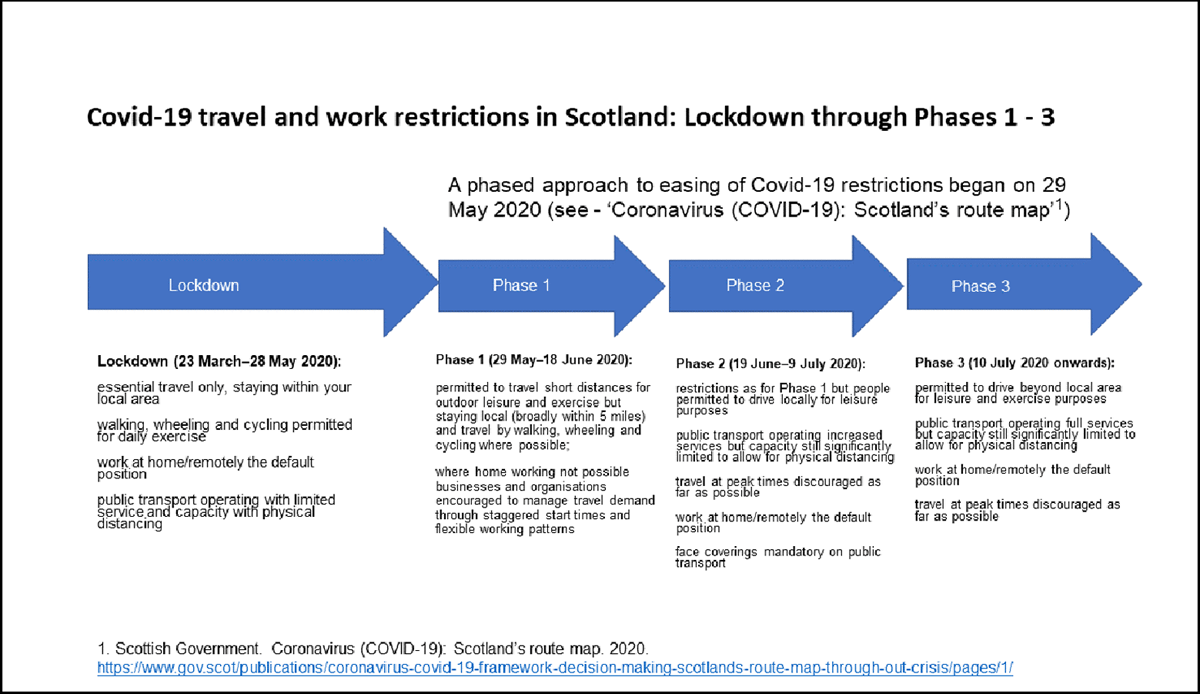
Details of COVID-19 travel and work restrictions in Scotland: lockdown through Phases 1–3.
During Phase 3, locally specific lockdowns, including additional travel restrictions, were imposed to deal with COVID outbreaks in parts of Dumfries and Galloway in early July and in Aberdeen in August. At the end of our study period (mid-August 2020), Scotland was still in Phase 3.
Analytical model and data
For the statistical analysis, we use the same 94 counters as in the descriptive analysis. However, we use data beginning from the January 1, 2019. The period prior to March 2020 contains some missing counts and some zero counts, which are likely to represent missing values. If two or more zeros appear in a row, they are marked as missing counts. However, we retain the other data from the counter for our analysis.
Our key independent variable is the set of dummy variables describing the time period of the observation. We have defined five categories based on the level of restrictions in place: Unrestricted (reference category), Lockdown, Phase 1, Phase 2 and Phase 3. We incorporate fixed effects to control for the day of the week. In addition, we include four variables to describe the weather and light conditions: daily centimetres of precipitation (Precip), temperature measured in degrees Celsius (Temp), the average wind speed for that day measured in metres per second (Wind) and the number of hours between sunrise and sunset (Daylight). For the Precip, Wind, and Temp variables, readings are taken from the weather stations closest to each counter. The length of the day is calculated based on the latitude and longitude of the counters. These variables have been used in previous studies to control for trends in cycling volumes (Fung, McArthur and Hong, 2021).
Given that we have repeated observations of a cross section of analytical units, we have a panel data structure. Our dependent variable, the daily number of cyclists, is a count variable. We therefore choose to use a Poisson fixed-effects regression model. This is suitable for the data structure, and the inclusion of fixed effects allows us to control for time-invariant unobserved heterogeneity.
Results
Descriptive trends
Initial impacts
The initial impact of lockdown, which commenced on Monday, March 23, was immediate. Comparing cycle counts on March 22 (a Sunday) with March 23 (a Monday and the first day of lockdown), there was a 35% reduction in cyclists counted between the two days. Given this period coincided with the transition from the weekend into the start of the week, a change might have been anticipated. However, the data show a clear dip in cycle volumes from March 22 until the middle of that week (March 25). From March 22 to 25, there was a 43% reduction in overall cycling volume, which breaks down into a 29% reduction on commuting routes, a reduction of 45% on mixed routes and a reduction of 53% on leisure routes. Bike hire data from Edinburgh shows a similar pattern, with a 66% reduction in hire journeys from March 22 to 25.
During lockdown and through Phases 1–3
The sharp reduction in cycling in the first days of lockdown was short and transitory. Cycle volumes on all routes then rose steadily over the lockdown period of late March through April and May. Following this, during Phases 1 and 2 of the release of restrictions (June and early July), cycle counts then reduced on all routes. By Phase 3 (July 10 onwards), cycle counts had broadly stabilised at a much lower level than during the lockdown period (Figure 3). However, this level was still higher than volumes before the lockdown period.
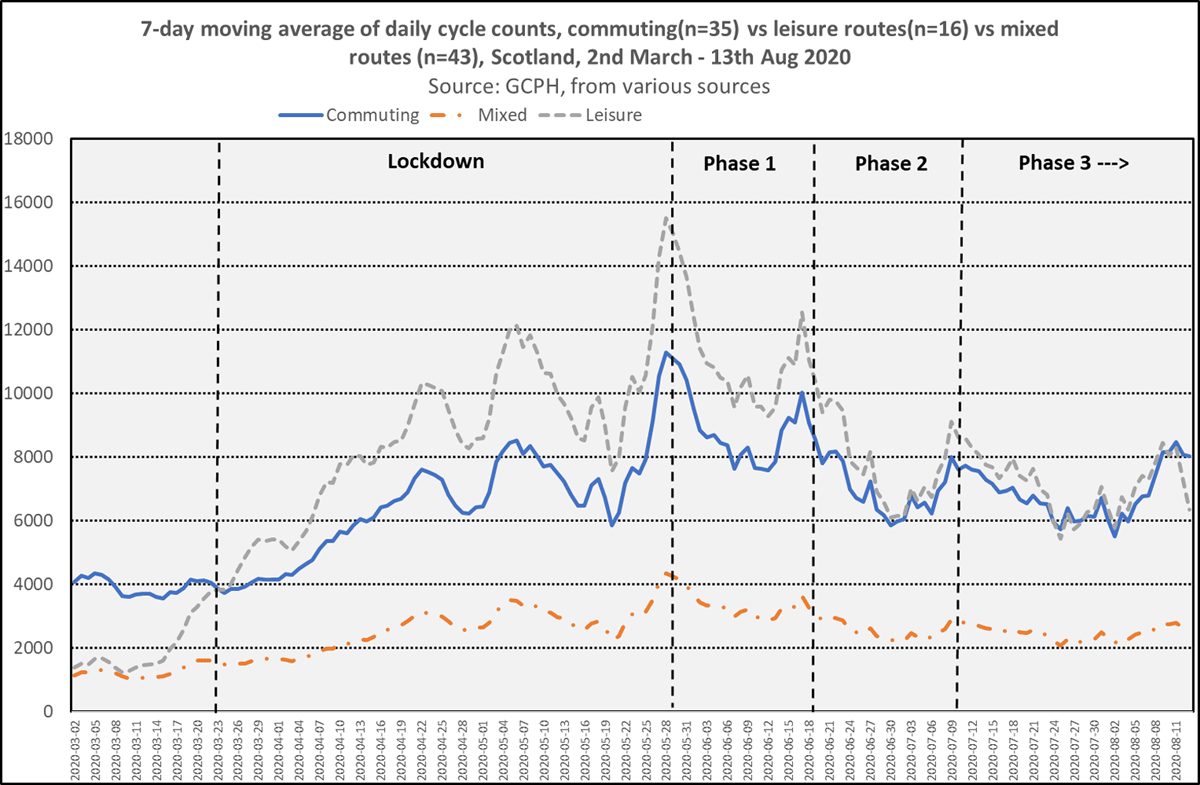
Seven-day moving average of daily cycle counts on commuting, leisure and mixed routes in Scotland, March 2–August 13, 2020.
To further illustrate these trends, we have taken Monday, March 2, three weeks before lockdown began, as a baseline and measured the percentage change in the seven-day moving average daily cycle counts from then to mid-August (Figure 4). The graph illustrates that cycle volumes by the end of lockdown (May 28) were approximately 10 times higher on leisure routes compared to the beginning of March, 2.7 times higher on commuting routes and 1.7 times higher on mixed routes. As noted above though, cycle volumes reduced during Phases 1 and 2, and by Phase 3 (in mid-August), cycle volumes on all routes had fallen yet further. In comparison to early March, cycle volumes were only 3.5 times higher on leisure routes and approximately double the early March volumes on commuting and mixed routes by mid-August 2020.
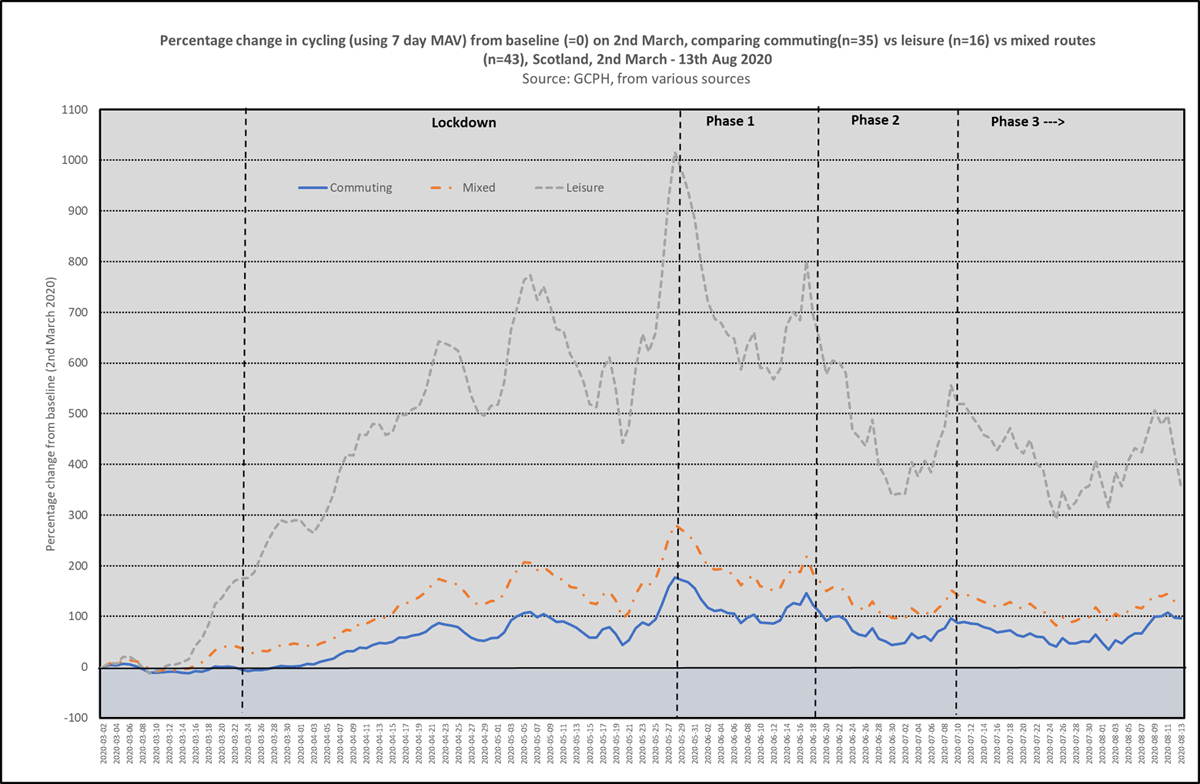
Percentage change in cycling from baseline on March 2 on commuting, leisure and mixed routes in Scotland, March 2–August 13, 2020.
Cycle hire data from Edinburgh shows a similar but more dramatic pattern. By the end of the lockdown period (May 28), the number of hire journeys being undertaken overall was three times that in early March before lockdown commenced and 13 times that when considering roundtrips alone. This had reduced to 2 times higher than the early March level by the end of Phase 3 in mid-August (reducing to 5 times higher for roundtrips alone). Analysis by time of day shows that in the total lockdown–Phase 3 period from April to August 2020, journey patterns altered from a predominantly commuting pattern of morning and evening peaks seen clearly in 2019 and up to March 2020. Instead, a much larger, longer peak in journeys across the whole afternoon is visible from April to August 2020, as shown in Figure 5, suggesting a greater use of the scheme by non-commuting cyclists, even on one-way journeys.
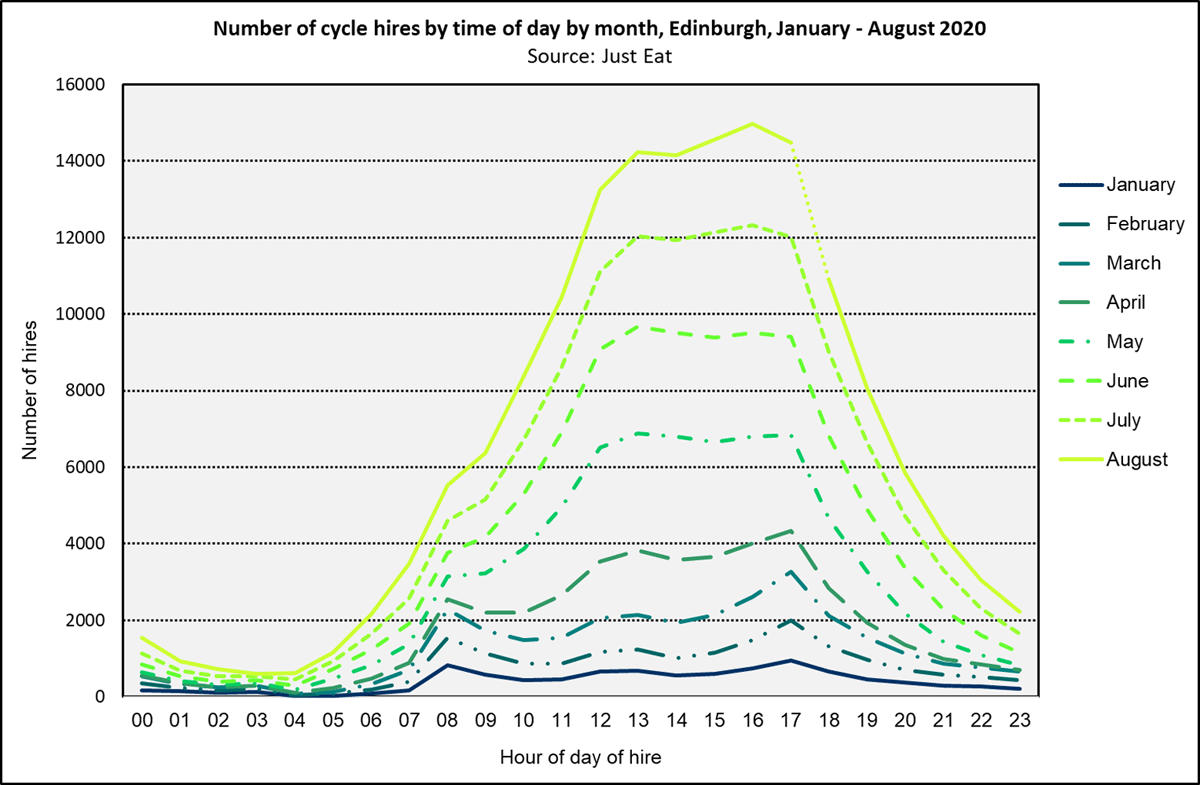
Number of cycle hires by time of day and by month, Edinburgh, January–August 2020.
Panel data model
The results of the panel data model applied to the cycle counter data are presented in Table 1. Separate models are estimated for counters which are primarily capturing commuting traffic, those capturing leisure and those which are mixed. In addition, a pooled model is estimated which includes all the counter sites in our sample.
Results of Poisson fixed-effect panel data model. Dependent variable: cycle count. Incidence rate ratios (IRRs) presented. Robust standard errors given in parentheses.
| Pooled | Commute | Leisure | Mixed | |
|---|---|---|---|---|
| Weather | ||||
| Wind | 0.956*** | 0.979*** | 0.930*** | 0.945*** |
| (0.004) | (0.003) | (0.006) | (0.009) | |
| Temp | 1.038*** | 1.030*** | 1.052*** | 1.036*** |
| (0.002) | (0.004) | (0.002) | (0.006) | |
| Precip | 0.972*** | 0.976*** | 0.950*** | 0.982 |
| (0.002) | (0.003) | (0.006) | (0.012) | |
| Daylight | 1.034*** | 1.020** | 1.076*** | 1.028 |
| (0.005) | (0.004) | (0.005) | (0.017) | |
| Time fixed effects. Ref: Sunday | ||||
| Monday | 1.042 | 1.361*** | 0.773*** | 0.997 |
| (0.046) | (0.069) | (0.012) | (0.055) | |
| Tuesday | 1.077 | 1.449*** | 0.774*** | 1.011 |
| (0.054) | (0.078) | (0.012) | (0.047) | |
| Wednesday | 0.062 | 1.434*** | 0.758*** | 0.987 |
| (0.053) | (0.074) | (0.010) | (0.084) | |
| Thursday | 1.033 | 1.410*** | 0.712*** | 0.971 |
| (0.055) | (0.074) | (0.014) | (0.084) | |
| Friday | 0.997 | 1.325*** | 0.719*** | 0.964 |
| (0.047) | (0.062) | (0.011) | (0.093) | |
| Saturday | 1.036 | 1.076*** | 1.002 | 1.013 |
| (0.009) | (0.011) | (0.012) | (0.014) | |
| Lockdown Restrictions. Ref: Pre-March 23, 2020 | ||||
| Lockdown | 1.546*** | 1.066 | 2.462*** | 1.403 |
| (0.141) | (0.129) | (0.135) | (0.458) | |
| Phase 1 | 1.606*** | 1.241 | 2.165*** | 1.441 |
| (0.119) | (0.145) | (0.115) | (0.372) | |
| Phase 2 | 1.295*** | 1.036 | 1.714*** | 1.200 |
| (0.087) | (0.119) | (0.078) | (0.214) | |
| Phase 3 | 1.221*** | 1.029 | 1.580*** | 1.135 |
| (0.067) | (0.088) | (0.062) | (0.166) | |
| N | 94 | 35 | 43 | 16 |
| 545 | 560 | 538 | 528 | |
*** p < 0.001; ** p < 0.01; * p < 0.05.
The results for the control variables are as expected. Better weather tends to be associated with increases in the volume of cycling, particularly for sites associated with leisure. Wind and rain decrease cycling volumes, while higher temperatures and longer days increase volumes. As expected, there is a positive association between cycling levels at commuting sites and weekdays, while cycling levels at leisure sites are higher on weekends.
Turning our attention to the lockdown variables, we begin with the pooled model. All phases of restrictions show a statistically significant increase in cycling volumes compared to the reference category of pre-March 23. During the period with the most stringent restrictions (lockdown), cycling volumes were up by around 55%. As restrictions were eased (Phases 1–3), volumes were still above where they were expected to be. However, this difference reduces as the restrictions are eased. By Phase 3, volumes were around 22% higher than what would be expected in the absence of any restrictions.
COVID-19 restrictions have no statistically significant effect on cycling volumes at commuting sites, and the weather, while still important, has less impact on these routes than on leisure routes. Given that many people were working from home, it is natural to suppose that there would be a reduction in cycle commuting volumes. However, it may be that during the period of restrictions, the commuting sites saw increases in leisure cycling which balance out the decrease in commuters. It could also be the case that essential workers were travelling to work by bicycle, which may have been considered a safer option given the concerns over virus transmission associated with public transport.
Leisure sites show large increases in traffic during COVID-19 restrictions. During the initial lockdown period and through Phase 1, volumes were more than double what they were expected to have been in the absence of restrictions. The effect attenuates as time passes and restrictions were eased, but volumes are still up by around 58% during Phase 3.
As expected, the results for the mixed sites lie somewhere between the commuting and leisure sites. None of the variables describing the restrictions are statistically significant.
Discussion
The impact of COVID-19 restrictions on cycling was immediate; between March 22 and 25, there was a 43% reduction in cycling volume on the routes in our study. However, this dip in cycling was brief, and cycle volumes on all routes rose steadily over the initial lockdown period until the end of May, at which point cycle volumes were approximately 10 times higher on leisure routes compared to the beginning of March, almost 2.7 times higher on commuting routes and 1.7 times higher on mixed routes. Through Phases 1 and 2 of the relaxing of restrictions, cycle volumes reduced steadily on all types of route.
It is to be expected that cycling volumes might increase as Scotland moves into the spring and summer periods. The hours of daylight increase substantially compared to winter, and the weather is generally more conducive to outdoor activity. However, even when controlling for weather and daylight patterns, we estimate the lockdown restrictions, and the easing of these restrictions, had a significant impact on cycling volumes, particularly leisure cycling.
Over the period studied, COVID-related restrictions on working, when many people were not able to work or worked from home, may have given people more time to cycle. Additionally, people were restricted in their outdoor activities, especially during the lockdown period when most sports participation was banned and walking, cycling and running were some of the few outdoor activities people could partake in.
Another factor encouraging more people to cycle was the fact that there was much less motorised traffic on the roads (Hong, McArthur and Raturi, 2020), and therefore it felt safer to cycle. In the first six months of the pandemic, Transport Scotland reported that car traffic dropped to around 25% of 2019 levels (before recovering to 91% of 2019 levels by the end of the period), while cycling activity was higher than in 2019 for most of the period. They attributed the latter to several factors, including people having more leisure time, people feeling safer due to reduced road traffic, and better weather (Transport Scotland, 2021). While there were significant restrictions on extra local travel during lockdown and Phases 1 and 2, by contrast, cycling for exercise was permitted throughout this period. The combination of these measures is likely to have reduced motorised traffic volumes and boosted cycling levels.
Increases in cycling between 2019 and 2020 have been reported in the USA and European cities, particularly on weekends and mainly for recreational journeys. In cities with relatively high levels of commuting cycling, levels of cycling to work or study reduced as people switched to working from home and remote learning, although cycling increased in other cities as people shifted from public transport. Increased bicycle sales have been reported in the USA, Australia and four European countries (Buehler and Pucher, 2021). In the UK, cycle sales rose by 60% in April 2020 compared to April 2019 (Bike Association, 2020).
It is difficult to directly compare the impacts of COVID-19 restrictions in Scotland with other countries because of differences in the timings and detail of work and travel restrictions and the different weather conditions. As we have shown, in Scotland, cycling levels increased during lockdown on leisure routes and declined gradually as restrictions eased, while usage on commuting routes was relatively unaffected. In many other European countries (the UK being an exception), cycling declined in lockdown periods as a result of severe travel restrictions, curfews, quarantines and closures of businesses, schools, universities, restaurants, and government offices, while once lockdowns were lifted, cycling levels rose sharply (Buehler and Pucher, 2021). By contrast, in Scotland, and indeed in the UK as a whole, cycling locally was never discouraged during lockdown or Phases 1–3. Over the period when COVID-19 restrictions were eased, notably fewer people cycled for leisure, and, perhaps significantly, road traffic rose again to close to pre-COVID levels.
During the pandemic, transport infrastructure has been redesigned rapidly and cheaply to support safe active travel (Dunning and Nurse, 2021). Many cities expanded their cycling facilities in 2020 (Buehler and Pucher, 2021), and increases in cycling in Europe have been associated with pop-up cycle lanes (Kraus and Koch, 2021). Similar funding has been made available for new temporary cycling infrastructure in Scotland (Sustrans, 2020). However, the delivery of much of the new infrastructure came after the initial lockdown period in March to May 2020 and so is unlikely to have had a large impact during our study period (to the middle of August 2020).
Given the data trends from the cycle counters and the cycle hire data in the period from mid-March to early August, it seems reasonable to conclude that the increase in cycling volumes observed in Scotland, particularly in the lockdown period, was mainly due to cycling for leisure or exercise. The good weather was a factor. The Met Office reported that March to May was the sunniest spring on record.2 Our analysis has shown that wind and rain reduced cycling, higher temperatures and longer days increased cycle volumes, and weather variables have much less impact on commuter routes. Previous studies have reported similar findings in terms of the impact of weather-related variables on cycling, which also shows that utilitarian cycling is less sensitive to weather than recreational cycling (Helbich, Böcker and Dijst, 2014; Nosal and Miranda-Moreno, 2014).
In a sense, the COVID-19 pandemic has had the elements of a natural experiment. The increase in levels of cycling during the study period demonstrates a latent demand for cycling when the conditions are right and it feels safe to do so. The initial two-month lockdown period, when the greatest increases in cycling occurred (on all types of routes), was a period of good weather when far fewer cars were on the roads.
In late July 2020, 64% of respondents to a nation panel survey conducted in Scotland agreed that they would walk and cycle more in the future (Transport Scotland, 2020b). Nevertheless, levels of cycling in Scotland remain relatively low, and safety concerns are a commonly voiced barrier to cycling (Cycling Scotland, 2018). Numbers and rates (per head of population) of serious cycle casualties have risen in the last decade in Scotland; one in ten reported cycle casualties has been the victim of a hit-and-run incident. The real and perceived risks of cycling in Scotland deter many people (Young and Whyte, 2020). Nevertheless, this study shows that when conditions are favourable, more people will cycle. Reducing motorised traffic on roads (Laverty, Aldred and Goodman, 2021), town- and city-wide active travel initiatives (Cairns and Jones, 2016), 20 mph zones (Cleland et al., 2020) and safer dedicated infrastructure for cycling (Li, Graham and Liu, 2017) are all likely to reduce cycling casualties and encourage more people to cycle.
Some have suggested that the necessity to be at a physical distance from other people coupled with concerns over using public transport during the pandemic have contributed to people switching to cycling (Buehler and Pucher, 2021). Social distancing and COVID are seen as a public health opportunity for active travel; walking and cycling are safe modes of transport in this context and have other physical and mental health benefits, including potentially reducing COVID-19 mortality risk factors such as type 2 diabetes (Brooks, Tingay and Varney, 2021).
The Edinburgh bike hire scheme proved to be particularly popular during the lockdown period and through Phases 1–3. This increase in usage was mainly due to leisure cycling, associated with roundtrips and a longer afternoon peak for hires. In contrast, a study of the London bike hire scheme showed the daily number of cycle hires during COVID-19 restrictions was on average 22% lower relative to weekdays (Chibwe et al., 2021). It is likely that this difference in part relates to the normally more utilitarian use of the London scheme for commuting journeys, which would have been suppressed by lockdown restrictions on work.
There is evidence from New York that bike share schemes were more resilient during the pandemic than the city’s subways, and there was potentially a modal shift from the subway to the bike share system (Teixeira and Lopez, 2020). In Seoul, South Korea, commuters and weekend users of the public bike share system increased during the COVID-related period of social distancing compared with the same period in 2019 (Park, Kim and Lee, 2020). Bike share schemes were generally supported in the pandemic, and a range of large American cities and some large European cities have offered free or discounted access to bike sharing schemes during the pandemic (Buehler and Pucher, 2021).
Our study has demonstrated the utility of a network of cycle counters across Scotland, and such a system is a necessity to measure the impact of new cycling infrastructure on levels of cycling as part of the shift to a low-carbon, active and sustainble tranport system. Monitoring travel trends, even during the exceptional period of a global pandemic, can allow us to better understand what factors encourage and discourage everyday cycling. Nevertheless, collating the data required for this study from multiple sources and cleaning the data to create a consistent dataset was a significant task. A similar planned analysis of walking during the pandemic using automatic counter data from the same sources had to be omitted due to data quality concerns. Better quality walking and cycling data provided in a consistent format from a single open data source would facilitate future analysis of active travel trends in Scotland.
Strengths and weaknesses
The data used from this study come from a network of automatic counters covering urban and rural Scotland; however, although two-thirds of local authority areas in Scotland are represented, one-third of local authorities are not. The sites included provide good examples of leisure and commuting routes but do not provide comprehensive coverage of all the places where people are likely to cycle; for example, mountain bike routes and routes used for shopping and meeting friends are likely to be under-represented. Edinburgh’s Just Eat bike hire data may include a broader range of cycle journeys.
The addition of weather station measurements has allowed the impact of meteorological conditions on cycling levels to be assessed alongside COVID-related travel restrictions. There are some limitations. We gathered weather data from the closest suitable weather station to each counter. However, in some cases, this was still quite a distance away. Conditions at the weather station may therefore have varied compared to the cycle counting site. In addition, there were some missing values. This was particularly true for precipitation data. Despite this, the overall pattern of the weather data looks reasonable, and the results derived were intuitive.
The counters provide less than two years of data, and missing and erratic counts meant data from 71 counter sites had to be excluded, with slightly more commuting routes than leisure routes removed. This also reduced the geographic coverage of counters used in the analysis from 22 of the 32 Scottish local authorities to 20 local authorities. Overall, the counters used are predominantly situated in more urban areas, which may mean that our findings are less representative of patterns of cycling in rural parts of Scotland in this period.
Our categorisation of three types of routes (commuting, leisure and mixed) based on pre-COVID weekly patterns of usage is still relatively subjective and non-definitive; a proportion of cyclists counted on the commuting routes will have been leisure users or will have been cycling for another purpose, and a proportion of those counted on leisure routes will equally have been commuters or cycling for other purposes. This approach is pragmatic but differs from most studies which identify commuting and leisure cycling more directly, using self-reported data for individuals collected via a travel diary or questionnaire.
The counter data does not provide any demographic data on cyclists and so cannot reveal any trends or patterns by age, gender or by any other personal characteristics. Given existing inequalities in access to a bicycle and who cycles in Scotland (Transport Scotland, 2020a), it is possible that those who have contributed to and benefited from the rise in cycling over lockdown and beyond are broadly from a more affluent demographic. This is an important issue for future research to address.
These data cannot be used to assess the impact of any new temporary cycling infrastructure that has been created during the pandemic to enable physical distancing. Nor can the direct impact on cycling levels of reduced public transport services and usage due to COVID-19 restrictions be assessed from these data. Nevertheless, both of these factors may have influenced cycling levels in the period of study.
Conclusions
This study helps us to understand the impact of COVID-19 restrictions on cycling in Scotland during the early period of the pandemic. This is important, as cycling and other forms of active travel have been encouraged during the period of the pandemic as a means of exercise and for utilitarian travel, especially given the public health concerns about transmissibility of the virus on public transport and reduced services during the pandemic.
We have been able to show the clear positive impact of good weather and lengthening daylight hours on levels of cycling, but we also show that the COVID restrictions have had important independent effects on cycling. The immediate impact of the first lockdown in Scotland was to reduce all travel, including cycling, but only for a matter of days. After this initial reduction, there was a statistically significant increase in cycling volumes overall (across all routes), through all the phases of restrictions, up until mid-August 2020 (the end of our study period). The largest rise was in lockdown, the period with the tightest restrictions, and as restrictions were eased in Phases 1–3, cycle volumes reduced progressively, although they remained above expected levels.
Leisure sites showed the largest increases in traffic from the outset. COVID-19 restrictions had no statistically significant effect on cycling volumes at commuting or mixed sites, and the weather, while still important, had less impact on these routes than on leisure routes.
Apart from good weather, which clearly helped boost cycling levels during the study period, other factors may have been important. In the initial lockdown period, most people were confined to home, with many either working from home or furloughed. There was less motorised traffic on the roads, people had more free time and exercise opportunities were largely restricted to walking and cycling in areas local to people’s homes. The lack of motorised traffic and greater numbers of cyclists out on the streets may have contributed to a perception that it was safer to cycle, particularly in the early months of restrictions before motorised traffic volumes started to build up again. The pattern of higher levels of cycling in lockdown in Scotland contrasts with that of other European countries which enacted blanket restrictions on travel, leading to a large reduction in cycling.
Despite relatively low rates of everyday cycling in Scotland, the early phases of the COVID-19 pandemic and accompanying restrictions have demonstrated that more people will cycle when the prevailing circumstances are favourable. As COVID restrictions are eased and transport usage settles into new patterns, the lessons from this period can help in transitioning to a low-carbon, active and sustainable transport system. Cycling, alongside other modes of active travel, is now receiving record levels of investment in Scotland to encourage this shift, and accompanying policy recognises the co-benefits for health, air quality and local communities. Efforts to encourage cycling should focus on providing safer conditions to cycle: reducing motorised traffic where possible, lowering road speeds and providing safe dedicated infrastructure for cycling.
Notes
- https://edinburghcyclehire.com/open-data; this data portal is no longer available. ⮭
- https://www.carbonbrief.org/met-office-why-2020-saw-a-record-breaking-dry-and-sunny-spring-across-the-uk. ⮭
Acknowledgements
We would like to thank Nathan Farrell (Sustrans), Natalie Cozzolino (Cycling Scotland) and Glasgow City Council for providing access to the cycle counter data.
Competing Interests
The authors have no competing interests to declare.
Author Contributions
All authors were involved in conceiving the study, developing the overarching research goals and designing the methodology. Data collection and descriptive analysis of the cycle counter data was conducted by BW, the panel data modelling was undertaken by DM and analysis of the Just Eat cycle hire data was conducted by LG. BW wrote the original draft and DM, ML and LG provided critical review and editing during the drafting process. All authors agreed to the final submitted manuscript.
References
1 Baker, G., Pillinger, R., Kelly, P. and Whyte, B. (2021). Quantifying the health and economic benefits of active commuting in Scotland. Journal of Transport and Health, 22, 101111. DOI: http://doi.org/10.1016/j.jth.2021.101111
2 Bike Association (2020). BA calls for e-bike incentives after revealing lockdown sales figures for April: explosive growth for lower-priced bikes but e-bike boom stalled. Press release. Available from https://www.bicycleassociation.org.uk/news-press/ba-calls-for-e-bike-incentives-after-revealing-lockdown-sales-figures-for-april-explosive-growth-for-lower-priced-bikes-but-e-bike-boom-stalled/ [Accessed January 2022].
3 Boseley, S. (2020). WHO declares coronavirus pandemic. The Guardian, March 11. Available from https://www.theguardian.com/world/2020/mar/11/who-declares-coronavirus-pandemic [Accessed January 2022].
4 Brooks, J.H.M., Tingay, R. and Varney, J. (2021). Social distancing and COVID-19: an unprecedented active transport public health opportunity. British Journal of Sports Medicine, 55, 411–412. DOI: http://doi.org/10.1136/bjsports-2020-102856
5 Buehler, R. and Pucher, J. (2021). COVID-19 Impacts on cycling, 2019–2020. Transport Reviews, 41 (4), 393–400. DOI: http://doi.org/10.1080/01441647.2021.1914900
6 Cairns, S. and Jones, M. (2016). Sustainable travel towns: an evaluation of the longer term impacts—main report. Report for the Department for Transport, PPR776. Available from https://assets.publishing.service.gov.uk/government/uploads/system/uploads/attachment_data/file/738305/ppr776-sustainable-travel-towns-final-report.pdf [Accessed January 2022].
7 Carslaw, D. (2020). Worldmet: import surface meteorological data from NOAA Integrated Surface Database (ISD). R package version 0.9.2. Available from https://CRAN.R-project.org/package=worldmet [Accessed January 2022].
8 Chibwe, J., Heydaria, S., Faghih-Imani, A. and Scurtua, A. (2021). An exploratory analysis of the trend in the demand for the London bike-sharing system: from London Olympics to COVID-19 pandemic. Sustainable Cities and Society, 69, 102871. DOI: http://doi.org/10.1016/j.scs.2021.102871
9 Cleland, C. L., McComb, K., Kee, F., Jepson, R., Kelly, M. P., Milton, K., Nightingale, G., Kelly, P., Baker, G., Craig, N., Williams, A. J. and Hunter, R. F. (2020). Effects of 20 mph interventions on a range of public health outcomes: a meta-narrative evidence synthesis. Journal of Transport & Health, 17, 100633. DOI: http://doi.org/10.1016/j.jth.2019.100633
10 Cycling Scotland (2018). Attitudes and behaviours towards cycling in Scotland. Available from https://www.cycling.scot/mediaLibrary/other/english/4209.pdf [Accessed January 2022].
11 Cycling Scotland (2020). Six-month stats see cycling up 43% in Scotland. September 23. Available from https://www.cycling.scot/news-and-blog/article/six-month-stats-see-cycling-up-43-in-scotland [Accessed January 2022].
12 Davis, A. and Whyte, B. (2020). Making the shift to sustainable transport in Scotland. Cities & Health. DOI: http://doi.org/10.1080/23748834.2020.1812332
13 Department for Transport (2017). Commuting trends in England 1988–2015. London: DfT. Available from https://assets.publishing.service.gov.uk/government/uploads/system/uploads/attachment_data/file/877039/commuting-in-england-1988-2015.pdf [Accessed January 2022].
14 Department for Transport (2020). Transport use during the coronavirus (COVID-19) pandemic. June 3. Available from https://www.gov.uk/government/statistics/transport-use-during-the-coronavirus-covid-19-pandemic [Accessed January 2022].
15 De Vos, J. (2020). The effect of COVID-19 and subsequent social distancing on travel behaviour. Transportation Research Interdisciplinary Perspectives, 5, 100121. DOI: http://doi.org/10.1016/j.trip.2020.100121
16 Dunning, R. J. and Nurse, A. (2021). The surprising availability of cycling and walking infrastructure through COVID-19. Town planning review, 92 (2), 149–155. DOI: http://doi.org/10.3828/tpr.2020.35
17 Felstead, A. (2012). Rapid change or slow evolution? Changing places of work and their consequences in the UK. Journal of Transport Geography, 21, 31–38. DOI: http://doi.org/10.1016/j.jtrangeo.2011.10.002
18 Fung, C. M., McArthur, D. P. and Hong, J. (2021). Examining the effects of a temporary subway closure on cycling in Glasgow using bike-sharing data. Travel Behaviour and Society, 25, 62–77. DOI: http://doi.org/10.1016/j.tbs.2021.06.002
19 Garnham, L. (2020). Walking during the lockdown in Scotland. Glasgow Centre for Population Health, July 9. Available from https://www.gcph.co.uk/latest/news/946_walking_during_the_lockdown_in_scotland [Accessed January 2022].
20 Helbich, M., Böcker, L. and Dijst, M. (2014). Geographic heterogeneity in cycling under various weather conditions: evidence from Greater Rotterdam. Journal of Transport Geography, 38, 38–47. DOI: http://doi.org/10.1016/j.jtrangeo.2014.05.009
21 Hong, J., McArthur, D. and Raturi, V. (2020). Did safe cycling infrastructure still matter during a COVID-19 lockdown? Sustainability, 12 (20), 8672. DOI: http://doi.org/10.3390/su12208672
22 Kraus, S. and Koch, N. (2021). Provisional COVID-19 infrastructure induces large, rapid increases in cycling. PNAS, 118 (15), e2024399118. DOI: http://doi.org/10.1073/pnas.2024399118
23 Laverty, A. A., Aldred, R. and Goodman, A. 2021. The impact of introducing low traffic neighbourhoods on road traffic injuries. Findings, January 12. DOI: http://doi.org/10.32866/001c.18330
24 Laverty, A. A., Millett, C., Majeed, A. and Vamos, E. P. (2020). COVID-19 presents opportunities and threats to transport and health. Journal of the Royal Society of Medicine, 113 (7), 251–254. DOI: http://doi.org/10.1177/0141076820938997
25 Li, H., Graham, D. J. and Liu, P. (2017). Safety effects of the London cycle superhighways on cycle collisions. Accident Analysis & Prevention, 99, 90–101. DOI: http://doi.org/10.1016/j.aap.2016.11.016
26 Nosal, T. and Miranda-Moreno, L. F. (2014). The effect of weather on the use of North American bicycle facilities: a multi-city analysis using automatic counts. Transportation Research Part A: Policy and Practice, 66, 213–225. DOI: http://doi.org/10.1016/j.tra.2014.04.012
27 Office for National Statistics (2014). 2011 census analysis, method of travel to work in England and Wales. Available from https://webarchive.nationalarchives.gov.uk/ukgwa/20160107181726/http://www.ons.gov.uk/ons/publications/re-reference-tables.html?edition=tcm%3A77-295663 [Accessed January 2022].
28 Park, S., Kim, B. and Lee, J. (2020). Social distancing and outdoor physical activity during the COVID-19 outbreak in South Korea: implications for physical distancing strategies. Asia Pacific Journal of Public Health, 32 (6–7), 360–362. DOI: http://doi.org/10.1177/1010539520940929
29 R Core Team (2020). R: a language and environment for statistical computing. R Foundation for Statistical Computing. Available from https://www.R-project.org/ [Accessed January 2022].
30 Scottish Government (2018). Active Scotland delivery plan. Edinburgh: Scottish Government. Available from https://www.gov.scot/publications/active-scotland-delivery-plan/ [Accessed January 2022].
31 Scottish Government (2019). Place Standard tool strategic plan 2020–2023. Edinburgh: Scottish Government; Available from https://placestandard.scot/docs/Place_Standard_Strategic_Plan.pdf [Accessed January 2022].
32 Scottish Government (2020a). Budget agreement reached. February 26. Available from https://www.gov.scot/news/budget-agreement-reached/ [Accessed January 2022].
33 Scottish Government (2020b). Cleaner air for Scotland 2: consultation. Edinburgh: Scottish Government. Available from https://www.gov.scot/publications/cleaner-air-scotland-2-draft-air-quality-strategy-consultation/ [Accessed January 2022].
34 Scottish Government (2020c). Coronavirus (COVID-19) update: first minister’s speech 23 March 2020. March 23. Available from https://www.gov.scot/publications/first-minister-covid-19-update-1/ [Accessed January 2022].
35 Scottish Government (2021). A fairer, greener Scotland: programme for government 2021–22. Edinburgh: Scottish Government; Available from https://www.gov.scot/publications/fairer-greener-scotland-programme-government-2021-22/ [accessed December 2021].
36 Scottish Parliament (2019). Climate change (emissions reductions targets) (Scotland) bill. Available from https://www.parliament.scot/parliamentarybusiness/Bills/108483.aspx [Accessed January 2022].
37 Sport England (2020). Active lives adult survey—mid-March to mid-May 2020. Coronavirus (COVID-19) report. London: Sport England. Available from https://sportengland-production-files.s3.eu-west-2.amazonaws.com/s3fs-public/2020-10/Active%20Lives%20Adult%20May%2019-20%20Coronavirus%20Report.pdf?2L6TBVV5UvCGXb_VxZcWHcfFX0_wRal7 [Accessed January 2022].
38 Sustrans (2020). Spaces for people: making essential travel and exercise safer during COVID-19. April 28. Available from www.sustrans.org.uk/our-blog/projects/2020/scotland/spaces-for-people-making-essential-travel-and-exercise-safer-during-coronavirus/ [Accessed January 2022].
39 Teixeira, J. F. and Lopes, M. (2020). The link between bike sharing and subway use during the COVID-19 pandemic: the case-study of New York’s Citi Bike. Transportation Research Interdisciplinary Perspectives, 6, 100166. DOI: http://doi.org/10.1016/j.trip.2020.100166
40 Teuton, J., Sloan, P., Whyte, B., Cope, A., Macdonald, A., Cozzolino, N., et al. (2020). Transport use, health and health inequalities: the impact of measures to reduce the spread of COVID-19. A rapid review of evidence in support of a health inequalities impact assessment. Edinburgh: Public Health Scotland. Available from https://www.publichealthscotland.scot/media/2850/transport-use-health-and-health-inequalities-oct2020-english.pdf [accessed January 2022].
41 Thieurmel, B. and Elmarhraoui, A. (2019). Suncalc: compute sun position, sunlight phases, moon position and lunar phase. r package version 0.5.0. Available from https://CRAN.R-project.org/package=suncalc [Accessed January 2022].
42 Transport Scotland (2014). A long-term vision for active travel in Scotland 2030. Edinburgh: Transport Scotland. Available from https://www.transport.gov.scot/media/33649/long-term-vison-for-active-travel-in-scotland-2030.pdf [Accessed January 2022].
43 Transport Scotland (2019). Scottish transport statistics No. 37 2018 edition. Edinburgh: Transport Scotland. Available from https://www.transport.gov.scot/media/44025/scottish-transport-statistics-no-37-2018-edition.pdf [Accessed January 2022].
44 Transport Scotland (2020a). COVID-19 public attitudes survey data: wave 1. May 28. Available from https://www.transport.gov.scot/publication/covid-19-public-attitudes-survey-data-wave-1/ [Accessed January 2022].
45 Transport Scotland (2020b). COVID-19 public attitudes survey data: wave 6. August 6. Available from https://www.transport.gov.scot/publication/covid-19-public-attitudes-survey-data-wave-6/ [Accessed January 2022].
46 Transport Scotland (2020c). National transport strategy: protecting our climate improving our lives. Available from https://www.transport.gov.scot/our-approach/national-transport-strategy/ [Accessed January 2022].
47 Transport Scotland (2020d). Transport and travel in Scotland 2019: results from the Scottish household survey. Edinburgh: Transport Scotland. Available from https://www.transport.gov.scot/media/48317/sct09201490081.pdf [Accessed January 2022].
48 Transport Scotland (2021). COVID-19—Scotland’s transport and travel trends during the first six months of the pandemic. Edinburgh: Transport Scotland. Available from https://www.transport.gov.scot/publication/covid-19-scotland-s-transport-and-travel-trends-during-the-first-six-months-of-the-pandemic/ [Accessed January 2022].
49 Warren, J. (2010). Civilising the streets. Edinburgh: Sustrans and Transform Scotland. Available from https://transform.scot/wp/wp-content/uploads/2014/12/Civilising-the-Streets.pdf [Accessed January 2022].
50 Young, M. and Whyte B. (2020). Cycling in Scotland: a review of cycling casualties, near misses and under-reporting. Glasgow: Glasgow Centre for Population Health. Available from https://www.gcph.co.uk/assets/0000/7810/Cycling_Casualties_in_Scotland.pdf [Accessed January 2022].