1. Introduction
Walking and cycling to school are the two most common modes of active transport to and from school (ATS). They are convenient and environmentally friendly ways to foster daily physical activity among adolescents (Aubert et al., 2018; Guthold et al.; 2020; Khan et al., 2020) while also providing a range of health, personal, and social benefits (Kek et al., 2019; Mandic, Hopkins et al., 2017; Carver et al., 2005). In New Zealand, fewer than 50% of adolescents use ATS (Smith et al., 2018), with walking being more popular than cycling to school (Mandic, Hopkins et al., 2017). Walking to school is also more popular in other countries, including Canada (59% vs 3%) (Larsen et al., 2009), China (40% vs 16%) (Sun, Liu and Tao, 2015), Great Britain (40% vs 16%) (Department for Transport, 2017), Ireland (18% vs 2%) (Murtagh, Dempster and Murphy, 2016), Spain (46% vs 2%) (Chillón et al., 2013), and Switzerland (34% vs 10%) (Bringolf-Isler et al., 2008). However, in some countries, such as Denmark (Cooper et al., 2006), Germany (Reimers et al., 2013), and the Netherlands (Bere et al., 2008), cycling to school is more popular than walking among adolescents at least in part due to a complex mix of socio-historical and cultural factors, ongoing investment in cycling-friendly infrastructure, and supportive policies (Pucher and Buehler, 2008).
In general, most studies have examined walking and cycling to school combined under the term “active transport” (Martin, Lee and Lowry, 2007; Babey et al., 2009; Evenson et al., 2006; Robertson-Wilson, Leatherdale and Wong, 2008) or focused on walking only (Mitra and Buliung, 2015) or cycling only (de Bruijn et al., 2005). However, walking and cycling are distinct modes of transport with distinct characteristics. For example, mode-specific enablers and barriers have been identified by both New Zealand adolescents (Mandic, Hopkins et al., 2017; Mandic et al., 2022) and their parents (Mandic et al., 2020), suggesting the importance of examining these two modes of ATS separately. In these New Zealand studies, both parents and adolescents perceived cycling as less safe with less social support and more environmental barriers than walking to school.
Further, most studies examining adolescents’ school travel have been conducted in main urban centres (Martin, Lee and Lowry, 2007; Mitra, Buliung and Roorda, 2010; Jones and Sliwa, 2016; Easton and Ferrari, 2015; Babey et al., 2009; Chillón et al., 2013), with few studies focusing on rural areas (Bungum et al., 2008; Sjolie and Thuen, 2002). As these geographic settings have distinct social, cultural, economic, and built environment contexts, the rates of adolescents’ walking and cycling to school as well as enablers of and barriers to their use are likely to differ in rural and urban areas. Typically, a higher prevalence of ATS is observed among adolescents in urban versus rural areas (Pabayo and Gauvin, 2008; Babey et al., 2009; Yang, Diez Roux and Bingham, 2011; Potoglou and Arslangulova, 2017; Sjolie and Thuen, 2002; Robertson-Wilson, Leatherdale and Wong, 2008; Fulton et al., 2005). This observation may at least in part be attributed to longer distances to school travelled by rural adolescents. In contrast, a New Zealand study reported a higher prevalence of ATS among adolescents in rural versus urban areas (Mandic et al., 2015).
Distance from home to school is the strongest predictor of ATS in adolescents (Ikeda et al., 2018; Mandic et al., 2015; De Meester et al., 2013). Threshold distances for adolescents walking to school range from 1.4 km to 3.0 km (Bere et al., 2008; Pocock et al., 2018; Nelson et al., 2008, Chillón et al., 2015), whereas reasonable cycling distances range from 3.0 km to 8.0 km (D’Haese et al., 2011; Nelson et al., 2008; Bere et al., 2008; Van Dyck et al., 2010), with large variability between countries. In addition, parental (Mandic et al., 2020) and adolescents’ (Mandic et al., 2022) perceptions and rates of walking and cycling to school change with increasing home-to-school distance. Thus, efforts to promote ATS will most likely only be effective among adolescents living within a reasonable walking and/or cycling distance from their school. Therefore, studies examining adolescents’ perceptions of walking and/or cycling to school should be conducted in adolescents for whom using ATS is potentially feasible.
In New Zealand, adolescents living within 4.8 km of their closest school are ineligible for school transport financial assistance (Ministry of Education, no date); consequently, they rely on walking, cycling, private vehicle transport, or public transport for their school travel. Although fare-based public buses are available in the main urban centres and some medium-sized urban areas, limited public transport provision is characteristic of rural areas internationally, including in New Zealand (Nutley, 2003; Nutley, 1996).
To address the paucity of rural transport knowledge, rural-specific transport habits and perceptions need to be investigated to develop appropriate place-based interventions and policies to promote ATS and ultimately increase adolescents’ physical activity. Research questions for this study were guided by socio-ecological frameworks of travel behaviour (Panter, 2008; Sallis, 2006) and the theory of planned behaviour (Ajzen, 2002). Socio-ecological frameworks of travel behaviour suggest that a wide range of individual, social, environmental, and policy factors influence how adolescents travel to school (Panter et al., 2010; Davison and Lawson, 2006; Pont et al., 2009). In addition, the theory of planned behaviour (Ajzen, 2002) illustrates the role of individual beliefs and perceptions. Briefly, this theory posits that the intention to use ATS, as a direct antecedent of the behaviour itself, can be predicted based on attitudes towards walking and cycling, subjective norms, and perceived behavioural control. Therefore, this study compared the perceptions of walking and cycling to school among adolescents attending a secondary school within 4.8 km (3.0 mi) of their home in rural settings in the Otago region of New Zealand.
2. Materials and methods
2.1. Setting
Currently, there is no internationally agreed upon definition of “rural” areas in New Zealand (Statistics New Zealand, no date). In the present study, “rural settings” were settlements/areas with populations of less than 1,000 residents, as defined by the New Zealand government (Statistics New Zealand, no date; Statistics New Zealand, 2020). The Built Environment and Active Transport to School (BEATS) Rural Study was conducted between February and September 2018 in the Otago region, New Zealand (White et al., 2021). Aside from the city of Dunedin, the region is made up of rural settlements and small urban (1,000–9,999 residents) and medium urban (10,000–29,999 residents) areas (Statistics New Zealand, 2020; Statistics New Zealand, 2018; Statistics New Zealand, 2019). Data were analysed for adolescents living in rural settlements who attended a secondary school in a rural area.
2.2. Participants
Adolescents (13 to 18 years of age; school years 9 to 13) from 11 out of 15 secondary schools outside of Dunedin city participated in this study. Years 9 to 13 are the last five years of school in New Zealand. This study focused on adolescents, as lower rates of ATS have been observed among adolescents versus children, at least partly due to increasing distance from home to secondary versus primary school (Pabayo and Gauvin, 2008; Bringolf-Isler et al., 2008). Adolescents provided written consent before participating; parental consent was not required. Survey and anthropometry data were collected using BEATS Study research methodology (Mandic, Williams et al., 2016; White et al., 2021) during one 50- to 60-minute school period under research staff supervision. This study protocol was approved by the University of Otago Human Ethics Committee (Ref. 17/178). Among 1,015 adolescents who participated, 961 had complete written consent forms and valid survey data, of whom 62 lived in rural settlements/areas in the Otago region and attended one of the five schools there (Figure 1). Inclusion criteria of home-to-school distance of up to 4.8 km was chosen because in the Otago region of New Zealand, rural high school students living within 4.8 km of school did not have any other obvious available mode of transport to school (e.g., public bus, subsidised school bus) and therefore needed to choose between ATS or being driven by a parent/self-driving.
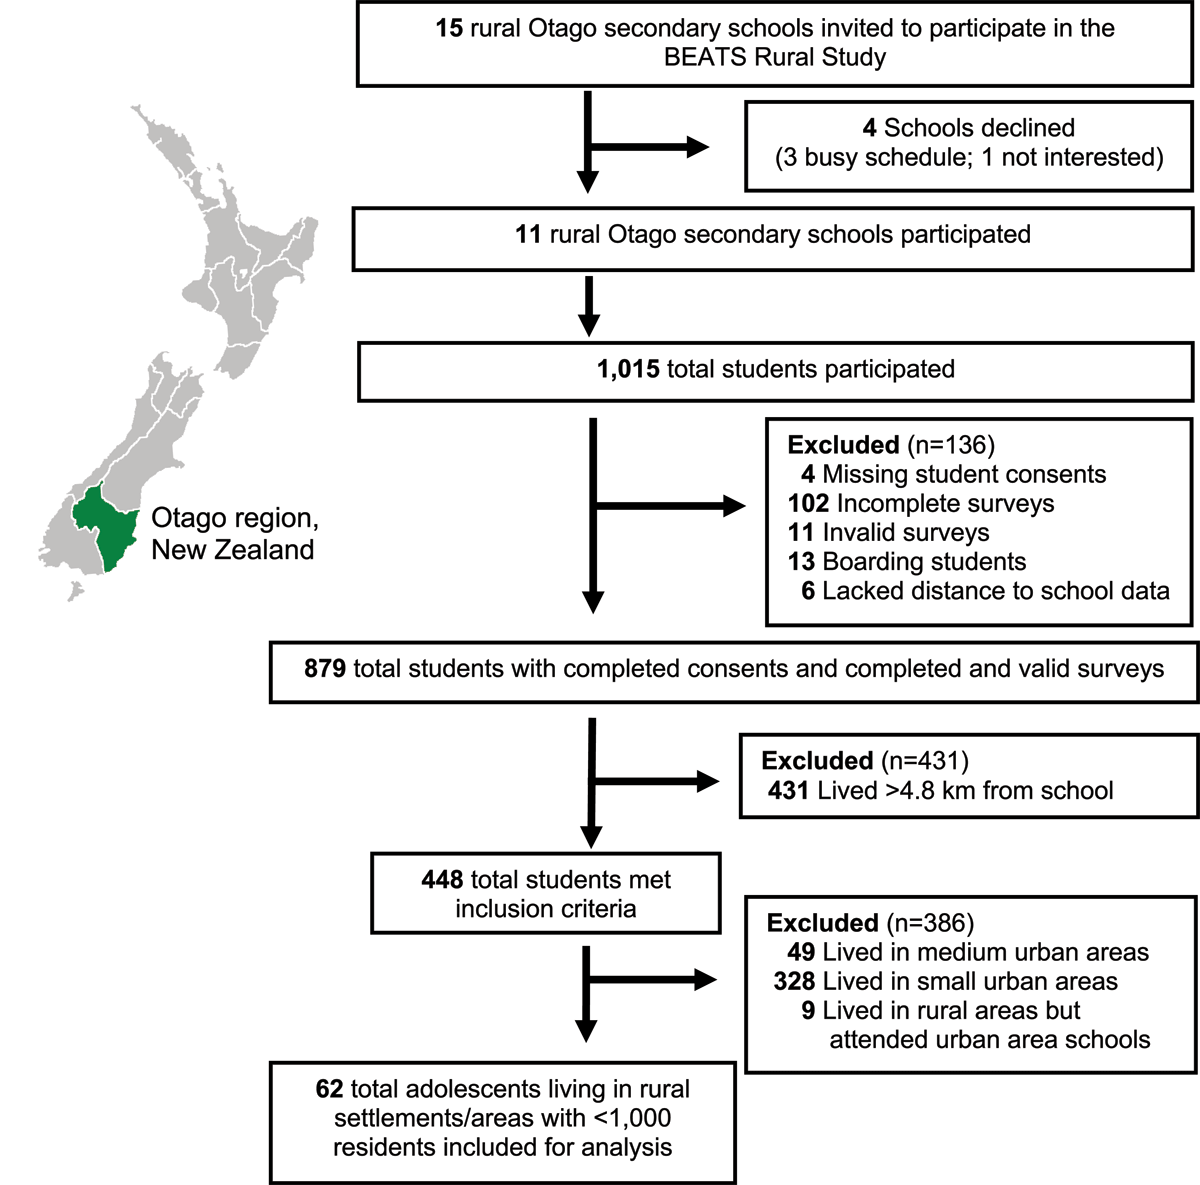
Flowchart of participant selection for data analysis.
2.3. Student survey measures
The structure of the BEATS survey was underpinned by socio-ecological models of physical activity and active transport (Panter et al., 2010; Spence and Lee, 2003) and the theory of planned behaviour (Ajzen, 2002). In the BEATS Rural Study, participants completed an online questionnaire that included items related to adolescents’ sociodemographic characteristics, transport to school habits, attitudes towards and perceptions of walking and cycling to school, and enablers of cycling to school. The items analysed for this article have been previously published (Mandic, Hopkins et al., 2017; Mandic et al., 2022) and are briefly summarised in the following.
2.3.1. Sociodemographic characteristics and distance to school
Adolescents self-reported their date of birth, gender, ethnicity, school year, home address, and family ownership of vehicles and bicycles. Home addresses were used to determine an index of neighbourhood deprivation and reported in quintiles (1 = least deprived to 5 = most deprived) as a proxy for neighbourhood socioeconomic status (Atkinson, Salmond and Crampton, 2014). Distance to school was determined using geographic information systems (GIS) analysis using the shortest network from home to school (Mandic, Williams et al., 2016). Home address was also used to categorise adolescents’ home locations, respectively, into one of the six urban and rural categories defined by Statistics New Zealand (Statistics New Zealand, 2018).
2.3.2. Travel to school
Adolescents reported the frequency of use of different modes of transport to school (i.e., car passenger, car driver, walking, cycling) using response categories “never”, “rarely”, “sometimes”, “most of the time”, and “all of the time”, as previously described (Mandic, Hopkins et al., 2017). Transport modes used “most of the time” and “all of the time” were used to categorise adolescents as using ATS, motorised transport only, or mixed modes (Mandic, Hopkins et al., 2017).
2.3.3 Beliefs about walking and cycling to school
All questions related to adolescents’ perceptions of walking and cycling to school were worded to ask about travel to school only to avoid the repetitiveness of the questions as well as to acknowledge that adolescents do not necessarily travel directly home from school but may travel to other destinations (such as to sport practices or visiting friends) which may have effects on their transport mode. As previously described (Mandic, Hopkins et al., 2017), adolescents’ attitudes towards walking and cycling to school were assessed by means of bipolar (–3 to +3) semantic differential scales, with response options framed by the adjectives “dull”–“interesting”, “unpleasant”–“pleasant”, and “boring”–“stimulating” for experiential beliefs and “unhealthy”–“healthy”, “bad”–“good”, and “useless”–“useful” for instrumental beliefs. Consistent with previous analyses (Mandic, Hopkins et al., 2017), scores on individual items from each scale were averaged to create a composite score for experiential beliefs and instrumental beliefs, respectively. Subjective and perceived norms were assessed by adolescents’ perceptions of peer and parental support and role modelling and school support for walking and cycling using a seven-point Likert scale. Perceived behavioural control was evaluated by means of items assessing adolescents’ perceived confidence and behavioural control to use ATS, and intention was assessed with items reflecting desire and intention to walk and cycle to school using a seven-point Likert scale. In addition to experiential and instrumental composite scores, a self-efficacy composite score was created as the average score of ability/capability/confidence items for cycling to school. A detailed description of how composite indicators were constructed has been published elsewhere (Mandic et al., 2022).
2.3.4. Personal motivations for and barriers to walking and cycling to school
Personal motivations (getting exercise, socialising with friends), personal barriers (time required, prior planning, amount to carry, after-school schedule, sweating, feeling tired, lack of interest), environmental barriers (distance, lack of footpaths/cycle paths, weather), and safety beliefs were assessed separately for walking and cycling. Responses were measured using a four-point Likert scale (1 = strongly disagree to 4 = strongly agree). Scores for personal barrier items were averaged to generate a personal barriers composite score for walking and cycling.
2.3.5 Perceptions of potential enablers of cycling to school
Adolescents reported their perceptions of potential enablers of cycling to school, such as reduced traffic speed and cycle-friendly school uniforms. Additional items assessed adolescents’ opinions about cycling in general, including enjoyment of recreational cycling, frequency of cycling with friends/parents, and perceived benefits of cycle skills training. Responses were measured using a four-point Likert scale (1 = strongly disagree to 4 = strongly agree).
2.4 Data analysis
Demographic characteristics were analysed using descriptive statistics. Response collected on a four-point Likert scale were recoded into two-category variables for analysis: [1] and [2] = “disagree”; [3] and [4] = “agree” response. Responses collected on a seven-point Likert scale were recoded into three-category variables for analysis: [1], [2], and [3] = “disagree”; [4] = “neutral”; [5], [6], and [7] = “agree” response. Categorical variables relating to beliefs about, motivations for and barriers to walking and cycling to school were compared using McNemar’s test and are reported as frequencies [n (%)]. Continuous variables (composite scores for experiential beliefs, instrumental beliefs, personal barriers, and number of friends who walked/cycled to school) for walking versus cycling to school were compared using paired t-tests and are reported as means ± standard deviation (SD). Data assumptions of normality for continuous variables were checked and showed skewness values between –2 and +2 and kurtosis between –7 and +7, with the exception of distance to school. Cronbach’s alpha internal consistency reliability coefficients were calculated for experiential beliefs: α = 0.84 [walking], 0.95 [cycling]; instrumental beliefs: α = 0.82 [walking], 0.86 [cycling]); and self-efficacy for cycling: α = 0.89; and personal barriers: α = 0.80 [walking], 0.82 [cycling]. Data were analysed using IBM SPSS Statistics Software (version 24.0). Statistical significance is indicated by a p-value of <0.001 to account for multiple statistical tests.
3. Results
3.1. Sociodemographic characteristics
Among 62 rural adolescents who lived £4.8 km from school (age: 15.6 ± 1.5 years; 53.2% female; 75.4% New Zealand European, 14.8% Māori (Indigenous people of New Zealand), 10% other ethnic groups), the median distance from home to school was 0.7 km (0.4 mi) (interquartile range: 0.5 km (0.3 mi)). Overall, 96.8% of adolescents had at least one bicycle, and all adolescents had at least one vehicle at home (Table 1).
Adolescents’ sociodemographic and school travel characteristics.
| Total (n = 62) | |
|---|---|
| Age (years) (mean ± SD) | 15.6 ± 1.5 |
| Gender [n (%)] | |
| Girls | 33 (53.2) |
| Boys | 29 (46.8) |
| Ethnicity [n (%)] | |
| New Zealand European | 46 (75.4) |
| Māori | 9 (14.8) |
| Pacific | 2 (3.3) |
| Asian | 0 (0) |
| Other | 4 (6.6) |
| Neighbourhood-level deprivation [n(%)] | |
| 1 (least deprived) | 0 (0) |
| 2 | 20 (32.3) |
| 3 | 20 (32.3) |
| 4 | 22 (35.5) |
| 5 (most deprived) | 0 (0) |
| Distance to school (km) [median (interquartile range)] | 0.7 (0.5) |
| Household vehicles [n (%)] | |
| None | 0 (0) |
| One | 14 (22.6) |
| Two or more | 48 (77.4) |
| Average (mean ± SD) | 2.4 ± 1.0 |
| Household bicycles to get to school [n (%)] | |
| None | 2 (3.2) |
| One | 20 (32.3) |
| Two or more | 40 (64.5) |
| Average (mean ± SD) | 2.3 ± 1.3 |
| Transport to school [n (%)] | |
| Active transport | 46 (74.2) |
| Motorised transport | 11 (17.7) |
| Combination of active and motorised transport | 5 (8.1) |
| Usual transport modes to school [n (%)] | |
| On foot^ | 45 (72.6) |
| By car (driven by others) | 8 (12.9) |
| By bike^ | 7 (11.3) |
| By car (driving myself) | 4 (6.5) |
| By car and on foot | 4 (6.5) |
| Other modes or combinations | 3 (4.8) |
-
SD = standard deviation; n = number.
^Some of the active transport users combined walking and cycling.
3.2. Travel to school habits
ATS was the most frequent mode of travel to school (74.2%), followed by motorised transport (17.7%) and mixed modes (8.1%) (Table 1). Overall, usual transport to school modes were 72.6% on foot, 11.3% by bicycle, 12.9% driven by others, 6.5% driving self, 6.5% by car and on foot, and 4.8% other modes or combinations (Table 1).
3.3. Attitudes, perceived norms, and perceived behavioural control and intention
No differences were observed in experiential or instrumental beliefs by mode of transport (experiential beliefs score: walking: 4.9 ± 1.2, cycling: 4.8 ± 1.4, p = 0.361; instrumental beliefs score: walking, 5.9 ± 1.1, cycling: 5.5 ± 1.2, p = 0.014). However, more adolescents perceived that walking to school received greater peer, parental, and school support, with greater peer and parental role modelling than for cycling (Table 2). Adolescents reported a greater number of friends who always or sometimes walk rather than cycle to school (2.2 ± 1.4 vs 0.6 ± 1.0, p < 0.001). Over two-thirds of adolescents reported having complete control in the decision to walk or cycle to school (p = 0.498) (Table 2). Similarly, more adolescents expressed having the desire and intention to walk to school compared with cycling (Table 2). The self-efficacy composite score for cycling was 5.1 ± 1.3 (out of 7).
Adolescents’ beliefs about walking and cycling to school.
| Walking to school (n = 62) | Cycling to school (n = 62) | P-value | |||||
|---|---|---|---|---|---|---|---|
| Agree n (%) | Neutral n (%) | Disagree n (%) | Agree n (%) | Neutral n (%) | Disagree n (%) | ||
| Attitudes (mean ± SD) | |||||||
| Experiential beliefs (interesting, pleasant, stimulating) | 4.9 ± 1.2 | 4.8 ± 1.4 | 0.361 | ||||
| Instrumental beliefs (healthy, good, useful) | 5.9 ± 1.1 | 5.5 ± 1.2 | 0.014 | ||||
| Subjective/perceived norm [n (%)] | |||||||
| My friends think I should walk/cycle to school.a | 23 (37.1) | 11 (17.7) | 4 (6.5) | 19 (30.6) | 30 (48.4) | 13 (21.0) | <0.001 |
| No other students walk/cycle to school.b | 7 (11.3) | 54 (87.1) | 22 (35.5) | 40 (64.5) | 0.001 | ||
| It is not considered cool to walk/cycle to school.b | 7 (11.3) | 55 (88.7) | 10 (16.1) | 52 (83.9) | 0.581 | ||
| My parents or guardians think I should walk/cycle to school.a | 50 (80.6) | 8 (12.9) | 4 (6.5) | 25 (40.3) | 25 (40.3) | 12 (19.4) | <0.001 |
| One or both of my parents or guardians walk/cycle frequently.a | 23 (37.1) | 11 (17.7) | 28 (45.2) | 13 (21.0) | 4 (6.5) | 45 (72.6) | 0.002 |
| My school encourages me to walk/cycle to school.b | 38 (61.3) | 24 (38.7) | 21 (33.9) | 41 (66.1) | <0.001 | ||
| Perceived behavioural control [n (%)] | |||||||
| I am confident I could walk/cycle to school.a | 57 (91.9) | 2 (3.2) | 3 (4.8) | 52 (83.9) | 7 (11.3) | 3 (4.8) | 0.249 |
| I see myself as being capable of riding a bicycle to school.a | 47 (75.8) | 8 (12.9) | 7 (11.3) | ||||
| I believe that I have the ability to ride a bicycle to school.a | 53 (85.5) | 6 (9.7) | 3 (4.8) | ||||
| I have complete control over whether or not I walk/cycle to school.a | 42 (67.7) | 11 (17.7) | 9 (14.5) | 46 (74.2) | 11 (17.7) | 5 (8.1) | 0.498 |
| Behavioural intentions [n (%)] | |||||||
| I want to regularly walk/cycle to school.a | 35 (56.5) | 16 (25.8) | 11 (17.7) | 16 (25.8) | 4 (6.5) | 42 (67.7) | <0.001 |
| I intend to walk/cycle to school frequently.a | 46 (74.2) | 6 (9.7) | 10 (16.1) | 8 (12.9) | 3 (4.8) | 51 (82.3) | <0.001 |
| Self-efficacy for cycling (mean ± SD) | 5.1 ± 1.3 | N/A | |||||
-
SD = standard deviation.
a Data collected using a 7-point Likert scale (1 = Strongly disagree to 7 = Strongly agree). Data recoded as 1, 2, 3 = disagree, 4 = neutral and 5, 6, 7 = agree to create categorical variables.
b Data collected on a 4-point Likert scale (1 = strongly disagree to 4 = strongly agree). Data recoded as 1, 2 = disagree and 3, 4 = agree to create categorical variables.
3.4. Personal motivations and barriers
While the majority of respondents perceived both walking and cycling to school to be great forms of exercise, a larger proportion favoured walking compared to cycling (Table 3). They also perceived that walking to school provided a better opportunity to socialise with friends (Table 3). In addition, adolescents perceived better physical infrastructure support for walking versus cycling to school, such as availability and quality of footpaths versus cycle lanes (Table 3). Most adolescents perceived both walking and cycling to school as safe. No significant difference was observed in adolescents’ perceptions of logistics-related barriers nor personal barriers for walking versus for cycling to school (composite score; walking: 1.7 ± 0.6, cycling: 1.8 ± 0.7, p = 0.165).
Personal motivations and barriers, environmental barriers, and safety perceptions of walking and cycling to school.
| Walking to school (n = 62) | Cycling to school (n = 62) | P-value | |||
|---|---|---|---|---|---|
| Agree n (%) | Disagree n (%) | Agree n (%) | Disagree n (%) | ||
| Personal motivations | |||||
| Walking/cycling to school is a great way to get some exercise. | 61 (98.4) | 1 (1.6) | 51 (82.3) | 11 (17.7) | 0.002 |
| I can chat to my friends on my walk/cycle to school. | 38 (61.3) | 24 (38.7) | 17 (27.4) | 45 (72.6) | <0.001 |
| Logistic-related barriers | |||||
| Walking/cycling to school takes too much time. | 13 (21.0) | 49 (79.0) | 7 (11.3) | 55 (88.7) | 0.180 |
| It involves too much planning ahead to walk/cycle to school. | 5 (8.1) | 57 (91.9) | 8 (12.9) | 54 (87.1) | 0.453 |
| I get too hot and sweaty walk/cycling to school. | 7 (11.3) | 55 (88.7) | 14 (22.6) | 48 (77.4) | 0.092 |
| I have too much stuff to carry to walk/cycle to school. | 13 (21.0) | 49 (79.0) | 25 (40.3) | 37 (59.7) | 0.004 |
| It is not convenient for me to walk/cycle to school because of my after-school schedule. | 14 (22.6) | 48 (77.4) | 13 (21.0) | 49 (79.0) | 0.999 |
| I often feel too tired to walk/cycle to school. | 17 (27.4) | 45 (72.6) | 16 (25.8) | 46 (74.2) | 0.999 |
| I often cannot be bothered to walk/cycle to school. | 22 (35.5) | 40 (64.5) | 25 (40.3) | 37 (59.7) | 0.629 |
| Environmental barriers | |||||
| It is too far to walk/cycle to school. | 7 (11.3) | 55 (88.7) | 0 (0) | 62 (100.0) | N/A |
| There are no footpaths/cycle paths along the way. | 9 (14.5) | 53 (85.5) | 40 (64.5) | 22 (35.5) | <0.001 |
| The weather is too cold and wet to walk/cycle to school in the winter. | 24 (38.7) | 38 (61.3) | 17 (27.4) | 45 (72.6) | 0.065 |
| Safety perceptions | |||||
| It is unsafe to walk/cycle to school. | 0 (0) | 62 (100.0) | 3 (4.8) | 59 (95.2) | N/A |
| My parents think it is not safe to walk/cycle to school. | 2 (3.2) | 60 (96.8) | 2 (3.2) | 60 (96.8) | 0.999 |
Data collected on a 4-point Likert scale (1 = strongly disagree to 4 = strongly agree). Data recoded as 1, 2 = disagree and 3, 4 = agree to create categorical variables.
3.5. Potential enablers of cycling to school
Overall, 41.0% of adolescents thought that cycle skills training would help them to feel safer when cycling in traffic, but only 27.9% would take such training at their school if it was available. With respect to cycling in general, 60.7% of the adolescents enjoyed cycling for recreation, 19.7% often cycled with their friends, and 18.0% often cycled with their parents. Rural adolescents reported that cycle-friendly uniforms (39.3%), having a school locker (34.4%), being able to cycle without a helmet (32.8%), safer bicycle storage (29.5%), and slower traffic on the roads (21.3%) would encourage them to cycle to school more frequently.
4. Discussion
The key findings are that the adolescents in rural settlements living within 4.8 km of school in Otago, New Zealand, (1) more frequently walked to school than cycled; (2) reported greater peer, parental, and school support for walking versus cycling to school; (3) perceived better physical infrastructure for walking compared to cycling to school; and (4) expressed greater desire and intention to walk than cycle to school. In contrast, their perceptions of safety, distance to school, and trip duration were not significantly different for walking versus cycling to school. This is one of the first studies to compare perceptions of walking versus cycling to school exclusively among rural adolescents. The findings illustrate differences in prevalence of and preferences for walking versus cycling to school as well as mode-specific barriers among adolescents living in rural New Zealand.
These findings extend the existing evidence from urban centres of New Zealand and other countries demonstrating that, compared to cycling, walking is more common, more favourable, and a better supported mode of transport to school among rural New Zealand adolescents who are ineligible for the subsidised school bus. In this sample of adolescents living within 4.8 km from their school, approximately three-quarters used ATS regularly (74%), with the rates of walking to school being significantly higher than the rates of cycling (73% vs 11%). These data are not directly comparable to findings from previous studies conducted in similar populations due to the lack of an internationally accepted definition of “rural” areas (Statistics New Zealand, no date), and in this study, only those living within 4.8 km from their school were included. It is also possible that the very short distance to school in our study sample (median distance: 700 m) may also have had an influence on mode choice for school travel for rural adolescents. For example, for such a short journey, getting the bicycle out, cycling to school, and locking it up at school may take more time than the time required to walk to school. However, although our inclusion criteria resulted in a relatively small sample size and very short median distance to school, the higher prevalence of walking versus cycling to school is similar to findings from other studies conducted in rural adolescents (Bungum et al., 2008; Nelson et al., 2008) as well as urban adolescents in many countries (Timperio et al., 2006; Sun, Liu and Tao, 2015; Department for Transport, 2017; Murtagh, Dempster and Murphy, 2016; Larsen et al., 2009; Buliung, Mitra and Faulkner, 2009; Chillón et al., 2013; Chillón et al., 2010; Bringolf-Isler et al., 2008), including New Zealand (Mandic, Hopkins et al., 2017; Mandic et al., 2015).
In the present study, 61% of adolescents stated that they like to cycle for recreation, and only one in five adolescents perceived that cycling to school is not cool. This suggests that most rural adolescents seem interested in cycling, despite the low percentage that actually cycled to school. Adolescents’ enjoyment of cycling should be considered in future actions aimed to encourage cycling to school in this age group. However, recreational cycling is most likely happening in locations different from the roads with traffic that rural adolescents encounter on their school route.
In this study, adolescents reported greater peer and parental support and peer and parental role modelling for walking compared to cycling to school. Only one-fifth of adolescents often cycled with friends or parents. Similar findings were previously reported among urban adolescents (Mandic, Hopkins et al., 2017) and their parents (Mandic et al., 2020) from Dunedin city, New Zealand. Extensive evidence from the literature points to the importance of peer support (Mandic, Hopkins et al., 2017; Hinckson, 2016; Deforche et al., 2010; Carver et al., 2005; Ducheyne et al., 2012) and parental support (Carver et al., 2005; Deforche et al., 2010; Mandic, Hopkins et al., 2017; Ducheyne et al., 2012) for both walking and cycling to school among adolescents. Change over time in social capital, social trust, and parental safety concerns limited adolescents’ active transport and independent mobility among Otago adolescents (Porskamp et al., 2019), further emphasising the importance of interventions to increase social support for adolescents’ ATS in rural areas.
The built environment also influences adolescents’ and their parents’ decisions about walking and/or cycling to school. In this study, rural adolescents reported greater availability and quality of infrastructure for walking (footpaths) compared to cycling (cycle lanes) to school. Similar findings have previously been reported by adolescents (Mandic, Hopkins et al., 2017; Hopkins and Mandic, 2017; Mandic et al., 2022) and their parents (Mandic et al., 2020) from Dunedin city, highlighting less physical infrastructure support for cycling in general, compared to walking, in both urban and rural areas of New Zealand. Previous studies conducted in urban centres reported that the presence of footpaths (Boarnet, Anderson et al., 2005a; Ewing, Schroeer and Greene, 2004; Ewing and Cervero, 2010; Fulton et al., 2005; Kerr et al., 2006) and/or cycle lanes (Kerr et al., 2006) and higher quality and greater availability of walking and cycling infrastructure (Aarts et al., 2012; Boarnet, Day et al., 2005b; De Meester et al., 2013; Fulton et al., 2005; McDonald et al., 2013; Stewart, 2011) are positively associated with higher rates of walking and/or cycling to school among adolescents. A systematic review by Smith et al. (2017) suggested that improvements in footpaths and the availability of cycle lanes could increase walking and cycling among adolescents. However, rural settings are fundamentally different from urban areas in terms of the provision, use, need, and likelihood of development of ATS-supportive physical infrastructure. For example, in rural areas, adolescents can walk on verges/edges and shoulders on roadsides. In contrast, cycling requires more specific infrastructure. Many towns and villages in the Otago region of New Zealand are located along main cycle trails built for tourism (New Zealand Cycle Trails, no date), but those cycle trails do not necessarily link residential areas to adolescents’ schools.
Few adolescents in rural New Zealand expressed concern about the safety of walking and cycling to school, which differs from findings in urban adolescents in New Zealand (Mandic, Hopkins et al., 2017; Mandic et al., 2022) and elsewhere (De Meester et al., 2013; Leslie et al., 2010; Aarts et al., 2012), where adolescents’ and their parents’ concerns about both personal safety (Evenson et al., 2006; Leslie et al., 2010; Aarts et al., 2012) and traffic safety (Mitra and Buliung, 2014; Carver et al., 2005, Hume et al., 2009; Giles-Corti et al., 2011) are negatively associated with adolescents’ ATS. The urban New Zealand study revealed a complex range of factors that contributed to perceptions of cycling safety, including features and perceptions of the built environment and traffic safety as well as previous cycling experiences (including crashes) and adolescents’ cycling skills and on-road experiences (Hopkins and Mandic, 2017). Since parental (Mandic et al., 2020) and adolescents’ (Mandic et al., 2022) perceptions of barriers to walking and cycling (e.g., perceived safety) vary by home-to-school distance, it is possible that the lack of safety concerns reported by rural adolescents in the present study is at least in part attributed to the study sample selection which resulted in half of rural adolescents living 0.7 km (0.4 mi) from their school.
Approximately one-quarter to one-third of rural adolescents in this study identified that cycle-friendly uniforms, having a school locker, being able to cycle without a helmet, safer bicycle storage at school, and slower traffic on the roads would encourage them to cycle to school more frequently. Similar findings were previously reported in urban New Zealand adolescents (Mandic, Hopkins et al., 2017). These findings provide valuable information for future interventions aimed at encouraging cycling to school among adolescents living in both rural and urban areas.
Although 41% of adolescents in the present study believed that cycling skills training would make them safer in traffic, approximately one-quarter stated that they would participate in such training at their schools, which is similar to findings previously reported in urban adolescents in New Zealand (Mandic, Flaherty et al., 2016; Mandic, Flaherty et al., 2017).
Previous studies have shown that cycle skills training can improve cycling-related knowledge of road rules and confidence to cycle among children (Mandic et al., 2018) and adolescent girls (Mandic et al., 2018), although such training did not increase the rates of cycling to school among urban adolescent girls following the 6- to 10-week training programme (Mandic et al., 2018). However, in countries like New Zealand, where traffic safety is a major barrier to cycling for transport, several weeks of cycle skills training is unlikely to prepare adolescents for safely sharing the roads with motorised vehicles. Instead, a cultural shift around cycling (i.e., perceived acceptability and thus appropriate safety measures in place) may be necessary to increase the rates of cycling for transportation.
4.1. Implications
Findings from this study illustrate differences in preferences for walking versus cycling to school as well as mode-specific barriers among adolescents living in rural New Zealand. These rural adolescents enjoyed cycling for recreation, but less than one-quarter had a desire or intention to cycle to school. Rural adolescents also perceived that cycling received less social support and had less favourable infrastructure compared to provisions for walking. Therefore, community consultation regarding safe cycling infrastructure combined with the efforts to create safe routes for walking and cycling to high school (Rahman et al., 2020) may encourage walking and, specifically, cycling to school among rural adolescents and increase peer, parental, and school support for ATS. Offering cycling-friendly school uniforms and providing safe bicycle storage at schools are also likely to have a positive impact on increasing rates of cycling to school among rural adolescents. Given the geographical specificity of Otago, the insights gained through this research are important to inform policy and intervention to encourage ATS in this region.
Although some urban ATS-related findings may also be relevant to the rural context, ATS interventions and recommendations for encouraging walking and cycling to school among rural adolescents need to be adapted to the local rural context, including context-specific barriers to walking and cycling.
4.2. Study strengths and limitations
The study sample was selected based on a reasonable distance to cycle to school (D’Haese et al., 2011; Nelson et al., 2008; Bere et al., 2008; Van Dyck et al., 2010) and locally relevant criteria (i.e., adolescents’ eligibility for school bus transport (Ministry of Education, no date)). Thus, our findings provide initial evidence of context-specific and transport mode–specific perceptions and barriers. In addition, this study examined a wide range of variables based on previous research in urban adolescents and theory that yielded valuable information on mode-specific barriers.
This study was limited by a relatively small sample size of rural adolescents, data collection from five schools in one region of New Zealand, and a lack of detailed assessment of personal versus traffic safety concerns related to ATS. By limiting the study to rural adolescents living within 4.8 km (3 mi) from their school, more than three-quarters of the adolescents surveyed in the BEATS Rural Study were excluded from the current analysis, and some of those who travelled by school bus may have cycled or walked to their bus stop. As rural areas differ across New Zealand, the results from this study may not be generalisable to other geographic locations in New Zealand or internationally.
5. Conclusions
Rural-specific research is necessary for advancing knowledge and understanding and for appropriately designing interventions that encourage walking and cycling within this context. Among adolescents living in rural New Zealand and residing within 4.8 km (3 mi) of their school, ATS participation was high, with the prevalence of walking to school being seven times higher than cycling. Compared to cycling to school, rural adolescents had more favourable perceptions of walking and considered walking as a more desired mode of transport to school, with better social and built environment support. Therefore, future initiatives to encourage ATS among rural adolescents need to consider adolescents’ perceptions of walking versus cycling, use mode-specific approaches, and address mode-specific barriers. Interventions in rural areas should also consider context-specific opportunities for, and barriers to, encouraging walking and cycling to and from school among adolescents. The current findings present initial evidence of differences in perceptions of walking versus cycling in a sample of rural adolescents that needs to be replicated in future studies using larger samples and, ideally, longitudinal designs.
Data Accessibility Statement
Data used in data analysis for this project will not be shared due to sensitivity of the collected data as well as participants having received assurances that the collected data will not be shared.
Acknowledgements
This research was part of the Built Environment and Active Transport to School (BEATS) Research Programme. The BEATS Rural Study was a collaboration between the Dunedin Secondary Schools’ Partnership, Otago Secondary Schools’ Partnership, Dunedin City Council, New Zealand Transport Agency, and University of Otago. We would like to acknowledge our research team members: BEATS investigators, Associate Professor Antoni Moore for performing GIS analysis, the members of the BEATS Study advisory board, research personnel (research assistants, students, and volunteers), and all participating schools and adolescents.
Funding Information
The BEATS Rural Study was supported by the University of Otago Research Grant [UORG 2018] and Otago Energy Research Centre Seed Grant 2018.
Competing Interests
Sandra Mandic is the founder and the director of the research consultancy AGILE Research Ltd. (www.agileresearch.nz) and principal advisor transport strategy at the Wellington City Council (Wellington, New Zealand). Other authors have no conflict of interest.
Author Contributions
Jessica Calverley: Conceptualisation, data curation, investigation, methodology, visualisation, writing original draft and review and editing. Debbie Hopkins: Conceptualisation, funding acquisition, methodology, writing review and editing. Enrique García Bengoechea: Conceptualisation, formal analysis, funding acquisition, methodology, writing review and editing. Kirsten Coppell: Conceptualisation, funding acquisition, methodology, writing review and editing. John C Spence: Conceptualisation, funding acquisition, methodology, writing review and editing. Sandra Mandic: Conceptualisation, data curation, formal analysis, funding acquisition, investigation, methodology, project administration, resources, supervision, writing original draft and review and editing.
References
1 Aarts, M.-J., Mathijssen, J. J., van Oers, J. A. and Schuit, A. J. (2012). Associations between environmental characteristics and active commuting to school among children: a cross-sectional study. International Journal of Behavioral Medicine, 20, 538–555. DOI: http://doi.org/10.1007/s12529-012-9271-0
2 Ajzen, I. (2002). Perceived behavioral control, self-efficacy, locus of control, and the theory of planned behavior. Journal of Applied Social Psychology, 32, 665–683. DOI: http://doi.org/10.1111/j.1559-1816.2002.tb00236.x
3 Atkinson, J., Salmond, C. and Crampton, P. (2014). NZDep2013 index of deprivation. University of Otago, Wellington. Available from https://www.otago.ac.nz/wellington/otago069936.pdf [Accessed: 19 October 2022]
4 Aubert, S., Barnes, J. D., Abdeta, C., Abi Nader, P., Adeniyi, A. F., Aguilar-Farias, N., Andrade Tenesaca, D. S., Bhawra, J., Brazo-Sayavera, J. and Cardon, G. (2018). Global matrix 3.0 physical activity report card grades for children and youth: results and analysis from 49 countries. Journal of Physical Activity and Health, 15, S251–S273.
5 Babey, S. H., Hastert, T. A., Huang, W. and Brown, E. R. (2009). Sociodemographic, family, and environmental factors associated with active commuting to school among US adolescents. Journal of Public Health Policy, 30, S203–S220. DOI: http://doi.org/10.1057/jphp.2008.61
6 Bere, E., van der Horst, K., Oenema, A., Prins, R. and Brug, J. (2008). Socio-demographic factors as correlates of active commuting to school in Rotterdam, the Netherlands. Preventive Medicine, 47, 412–416. DOI: http://doi.org/10.1016/j.ypmed.2008.06.019
7 Boarnet, M. G., Day, K., Anderson, C., McMillan, T. and Alfonzo, M. (2005a). California’s Safe Routes to School program: impacts on walking, bicycling, and pedestrian safety. Journal of the American Planning Association, 71, 301–317. DOI: http://doi.org/10.1080/01944360508976700
8 Boarnet, M. G., Anderson, C. L., Day, K., McMillan, T. and Alfonzo, M. (2005b). Evaluation of the California Safe Routes to School legislation: urban form changes and children’s active transportation to school. American Journal of Preventive Medicine, 28, 134–140. DOI: http://doi.org/10.1016/j.amepre.2004.10.026
9 Bringolf-Isler, B., Grize, L., Mäder, U., Ruch, N., Sennhauser, F. H. and Braun-Fahrländer, C. (2008). Personal and environmental factors associated with active commuting to school in Switzerland. Preventive Medicine, 46, 67–73. DOI: http://doi.org/10.1016/j.ypmed.2007.06.015
10 Buliung, R. N., Mitra, R. and Faulkner, G. (2009). Active school transportation in the Greater Toronto Area, Canada: an exploration of trends in space and time (1986–2006). Preventive Medicine, 48, 507–512. DOI: http://doi.org/10.1016/j.ypmed.2009.03.001
11 Bungum, T. J., Lounsbery, M., Moonie, S. and Gast, J. (2008). Prevalence and correlates of walking and biking to school among adolescents. Journal of Community Health, 34, 129. DOI: http://doi.org/10.1007/s10900-008-9135-3
12 Carver, A., Salmon, J., Campbell, K., Baur, L., Garnett, S. and Crawford, D. (2005). How do perceptions of local neighborhood relate to adolescents’ walking and cycling? American Journal of Health Promotion, 20, 139–147. DOI: http://doi.org/10.4278/0890-1171-20.2.139
13 Chillón, P., Martínez-Gómez, D., Ortega, F. B., Pérez-López, I. J., Díaz, L. E., Veses, A. M., Veiga, O. L., Marcos, A. and Delgado-Fernández, M. (2013). Six-year trend in active commuting to school in Spanish adolescents. The AVENA and AFINOS studies. International Journal of Behavioral Medicine, 20, 529. DOI: http://doi.org/10.1007/s12529-012-9267-9
14 Chillón, P., Ortega, F. B., Ruiz, J. R., Veidebaum, T., Oja, L., Mäestu, J. and Sjöström, M. (2010). Active commuting to school in children and adolescents: an opportunity to increase physical activity and fitness. Scandinavian Journal of Public Health, 38, 873–879. DOI: http://doi.org/10.1177/1403494810384427
15 Chillón, P., Panter, J., Corder, K., Jones, A. P. and Van Sluijs, E. M. F. (2015). A longitudinal study of the distance that young people walk to school. Health & Place, 31, 133–137. DOI: http://doi.org/10.1016/j.healthplace.2014.10.013
16 Cooper, A., Wedderkopp, N., Wang, H., Andersen, L., Froberg, K. and Page, A. (2006). Active travel to school and cardiovascular fitness in Danish children and adolescents. Medicine & Science in Sports & Exercise, 38, 1724–1731. DOI: http://doi.org/10.1249/01.mss.0000229570.02037.1d
17 D’Haese, S., De Meester, F., De Bourdeaudhuij, I., Deforche, B. and Cardon, G. (2011). Criterion distances and environmental correlates of active commuting to school in children. International Journal of Behavioral Nutrition and Physical Activity, 8, 88. DOI: http://doi.org/10.1186/1479-5868-8-88
18 Davison, K. and Lawson, C. T. (2006). Do attributes in the physical environment influence children’s physical activity? A review of the literature. International Journal of Behavioral Nutrition and Physical Activity, 3, 19. DOI: http://doi.org/10.1186/1479-5868-3-19
19 de Bruijn, G.-J., Kremers, S. P., Schaalma, H., van Mechelen, W. and Brug, J. (2005). Determinants of adolescent bicycle use for transportation and snacking behavior. Preventive Medicine, 40, 658–667. DOI: http://doi.org/10.1016/j.ypmed.2004.09.003
20 De Meester, F., Van Dyck, D., De Bourdeaudhuij, I., Deforche, B. and Cardon, G. (2013). Does the perception of neighborhood built environmental attributes influence active transport in adolescents? International Journal of Behavioral Nutrition and Physical Activity, 10, 38. DOI: http://doi.org/10.1186/1479-5868-10-38
21 Deforche, B., Van Dyck, D., Verloigne, M. and De Bourdeaudhuij, I. (2010). Perceived social and physical environmental correlates of physical activity in older adolescents and the moderating effect of self-efficacy. Preventive Medicine, 50, S24–S29. DOI: http://doi.org/10.1016/j.ypmed.2009.08.017
22 Department for Transport. (2017). Transport statistics Great Britain 2017. London: Department for Transport.
23 Ducheyne, F., De Bourdeaudhuij, I., Spittaels, H. and Cardon, G. (2012). Individual, social and physical environmental correlates of “never” and “always” cycling to school among 10 to 12 year old children living within a 3.0 km distance from school. International Journal of Behavioral Nutrition and Physical Activity, 9, 142. DOI: http://doi.org/10.1186/1479-5868-9-142
24 Easton, S. and Ferrari, E. (2015). Children’s travel to school—the interaction of individual, neighbourhood and school factors. Transport Policy, 44, 9–18. DOI: http://doi.org/10.1016/j.tranpol.2015.05.023
25 Evenson, K. R., Birnbaum, A. S., Bedimo-Rung, A. L., Sallis, J. F., Voorhees, C. C., Ring, K. and Elder, J. P. (2006). Girls’ perception of physical environmental factors and transportation: reliability and association with physical activity and active transport to school. International Journal of Behavioral Nutrition and Physical Activity, 3, 28. DOI: http://doi.org/10.1186/1479-5868-3-28
26 Ewing, R. and Cervero, R. (2010). Travel and the built environment: a meta-analysis. Journal of the American Planning Association, 76, 265–294. DOI: http://doi.org/10.1080/01944361003766766
27 Ewing, R., Schroeer, W. and Greene, W. (2004). School location and student travel: analysis of factors affecting mode choice. Transportation Research Record, 1895 (1), 55–63. DOI: http://doi.org/10.3141/1895-08
28 Fulton, J. E., Shisler, J. L., Yore, M. M. and Caspersen, C. J. (2005). Active transportation to school: findings from a national survey. Research Quarterly for Exercise and Sport, 76, 352–357. DOI: http://doi.org/10.1080/02701367.2005.10599306
29 Giles-Corti, B., Wood, G., Pikora, T., Learnihan, V., Bulsara, M., Van Niel, K., Timperio, A., McCormack, G. and Villanueva, K. (2011). School site and the potential to walk to school: the impact of street connectivity and traffic exposure in school neighborhoods. Health & Place, 17, 545–550. DOI: http://doi.org/10.1016/j.healthplace.2010.12.011
30 Guthold, R., Stevens, G. A., Riley, L. M. and Bull, F. C. (2020). Global trends in insufficient physical activity among adolescents: a pooled analysis of 298 population-based surveys with 1·6 million participants. Lancet Child Adolescent Health, 4, 23–35. DOI: http://doi.org/10.1016/S2352-4642(19)30323-2
31 Hinckson, E. (2016). Perceived challenges and facilitators of active travel following implementation of the School Travel Plan programme in New Zealand children and adolescents. Journal of Transport & Health, 3, 321–325. DOI: http://doi.org/10.1016/j.jth.2016.05.126
32 Hopkins, D. and Mandic, S. (2017). Perceptions of cycling among high school students and their parents. International Journal of Sustainable Transportation, 11, 342–356. DOI: http://doi.org/10.1080/15568318.2016.1253803
33 Hume, C., Timperio, A., Salmon, J., Carver, A., Giles-Corti, B. and Crawford, D. (2009). Walking and cycling to school: predictors of increases among children and adolescents. American Journal of Preventive Medicine, 36, 195–200. DOI: http://doi.org/10.1016/j.amepre.2008.10.011
34 Ikeda, E., Stewart, T., Garrett, N., Egli, V., Mandic, S., Hosking, J., Witten, K., Hawley, G., Tautolo, E. S. and Rodda, J. (2018). Built environment associates of active school travel in New Zealand children and youth: a systematic meta-analysis using individual participant data. Journal of Transport & Health, 9, 117–131. DOI: http://doi.org/10.1016/j.jth.2018.04.007
35 Jones, S. E. and Sliwa, S. (2016). Peer reviewed: school factors associated with the percentage of students who walk or bike to school, School Health Policies and Practices Study, 2014. Preventing Chronic Disease, 13, E63. DOI: http://doi.org/10.5888/pcd13.150573
36 Kek, C. C., García Bengoechea, E., Spence, J. C. and Mandic, S. (2019). The relationship between transport-to-school habits and physical activity in a sample of New Zealand adolescents. Journal of Sport and Health Science, 8 (5), 463–470. DOI: http://doi.org/10.1016/j.jshs.2019.02.006
37 Kerr, J., Rosenberg, D., Sallis, J. F., Saelens, B. E., Frank, L. D. and Conway, T. L. (2006). Active commuting to school: associations with environment and parental concerns. Medicine & Science in Sports & Exercise, 38, 787–793. DOI: http://doi.org/10.1249/01.mss.0000210208.63565.73
38 Khan, A., Mandic, S. and Uddin, R. (2020). Association of active school commuting with physical activity and sedentary behaviour among adolescents: a global perspective from 80 countries. Journal of Science and Medicine in Sport. DOI: http://doi.org/10.1016/j.jsams.2020.12.002
39 Larsen, K., Gilliland, J., Hess, P., Tucker, P., Irwin, J. and He, M. (2009). The influence of the physical environment and sociodemographic characteristics on children’s mode of travel to and from school. American Journal of Public Health, 99, 520. DOI: http://doi.org/10.2105/AJPH.2008.135319
40 Leslie, E., Kremer, P., Toumbourou, J. W. and Williams, J. W. (2010). Gender differences in personal, social and environmental influences on active travel to and from school for Australian adolescents. Journal of Science and Medicine in Sport, 13, 597–601. DOI: http://doi.org/10.1016/j.jsams.2010.04.004
41 Mandic, S., Flaherty, C., Ergler, C., Ching Kek, C., Pocock, T., Lawrie, D., Chillón, P. and García Bengoechea, E. (2018). Effects of cycle skills training on cycling-related knowledge, confidence and behaviour in adolescent girls. Journal of Transport & Health, 9, 253–263. DOI: http://doi.org/10.1016/j.jth.2018.01.015
42 Mandic, S., Flaherty, C., Pocock, T., Kek, C. C., Chillón, P., Ergler, C. and García Bengoechea, E. (2017). Parental perceptions of cycle skills training for adolescents. Journal of Transport & Health, 6, 411–419. DOI: http://doi.org/10.1016/j.jth.2017.03.009
43 Mandic, S., Flaherty, C., Pocock, T., Mintoft-Jones, A., Frater, J., Chillón, P. and García Bengoechea, E. (2016). Attitudes towards cycle skills training in New Zealand adolescents. Transportation Research Part F: Traffic Psychology and Behaviour, 42, 217–226. DOI: http://doi.org/10.1016/j.trf.2016.08.002
44 Mandic, S., García Bengoechea, E., Hopkins, D., Coppell, K. and Spence, J. (2022). Adolescents’ perceptions of walking and cycling to differ based on how far they live from school. Journal of Transport & Health, 24, 101316. DOI: http://doi.org/10.1016/j.jth.2021.101316
45 Mandic, S., Hopkins, D., García Bengoechea, E., Flaherty, C., Coppell, K., Moore, A., Williams, J., and Spence, J. C. (2020). Differences in parental perceptions of walking and cycling to high school according to distance. Transportation Research Part F: Traffic Psychology and Behaviour, 71, 238–249. DOI: http://doi.org/10.1016/j.trf.2020.04.013
46 Mandic, S., Hopkins, D., García Bengoechea, E., Flaherty, C., Williams, J., Sloane, L., Moore, A. and Spence, J. C. (2017). Adolescents’ perceptions of cycling versus walking to school: Understanding the New Zealand context. Journal of Transport & Health, 4, 294–304. DOI: http://doi.org/10.1016/j.jth.2016.10.007
47 Mandic, S., Leon de la Barra, S., García Bengoechea, E., Stevens, E., Flaherty, C., Moore, A., Middlemiss, M., Williams, J. and Skidmore, P. (2015). Personal, social and environmental correlates of active transport to school among adolescents in Otago, New Zealand. Journal of Science and Medicine in Sport, 18, 432–437. DOI: http://doi.org/10.1016/j.jsams.2014.06.012
48 Mandic, S., Williams, J., Moore, A., Hopkins, D., Flaherty, C., Wilson, G., García Bengoechea, E. and Spence, J. C. (2016). Built Environment and Active Transport to School (BEATS) Study: protocol for a cross-sectional study. BMJ Open, 6, e011196. DOI: http://doi.org/10.1136/bmjopen-2016-011196
49 Martin, S. L., Lee, S. M. and Lowry, R. (2007). National prevalence and correlates of walking and bicycling to school. American Journal of Preventive Medicine, 33, 98–105. DOI: http://doi.org/10.1016/j.amepre.2007.04.024
50 McDonald, N., Yang, Y., Abbott, S. M. and Bullock, A. N. (2013). Impact of the Safe Routes to School program on walking and biking: Eugene, Oregon study. Transport Policy, 29, 243–248. DOI: http://doi.org/10.1016/j.tranpol.2013.06.007
51 Ministry of Education. (no date). School transport—eligibility for school transport assistance. Available from https://www.education.govt.nz/school/property-and-transport/transport/sta-eligibility/#:~:text=Students%20must%20meet%20all%20three,3.2%20kilometres%20from%20the%20school. [Accessed 19 October 2022].
52 Mitra, R. and Buliung, R. N. (2014). The influence of neighborhood environment and household travel interactions on school travel behavior: an exploration using geographically-weighted models. Journal of Transport Geography, 36, 69–78. DOI: http://doi.org/10.1016/j.jtrangeo.2014.03.002
53 Mitra, R. and Buliung, R. N. (2015). Exploring differences in school travel mode choice behaviour between children and youth. Transport Policy, 42, 4–11. DOI: http://doi.org/10.1016/j.tranpol.2015.04.005
54 Mitra, R., Buliung, R. N. and Roorda, M. J. (2010). Built environment and school travel mode choice in Toronto, Canada. Transportation Research Record, 2156, 150–159. DOI: http://doi.org/10.3141/2156-17
55 Murtagh, E. M., Dempster, M. and Murphy, M. H. (2016). Determinants of uptake and maintenance of active commuting to school. Health & Place, 40, 9–14. DOI: http://doi.org/10.1016/j.healthplace.2016.04.009
56 Nelson, N. M., Foley, E., O’Gorman, D. J., Moyna, N. M. and Woods, C. B. (2008). Active commuting to school: how far is too far? International Journal of Behavioral Nutrition and Physical Activity, 5, 1. DOI: http://doi.org/10.1186/1479-5868-5-1
57 New Zealand Cycle Trails. (no date). The New Zealand Cycle Trail story. Available from https://nzcycletrail.com/about/the-new-zealand-cycle-trail-story/ [Accessed 30 September 2019].
58 Nutley, S. (1996). Rural transport problems and non-car populations in the USA: A UK perspective. Journal of Transport Geography, 4, 93–106. DOI: http://doi.org/10.1016/0966-6923(96)00002-6
59 Nutley, S. (2003). Indicators of transport and accessibility problems in rural Australia. Journal of Transport Geography, 11, 55–71. DOI: http://doi.org/10.1016/S0966-6923(02)00052-2
60 Pabayo, R. and Gauvin, L. (2008). Proportions of students who use various modes of transportation to and from school in a representative population-based sample of children and adolescents, 1999. Preventive Medicine, 46, 63–66. DOI: http://doi.org/10.1016/j.ypmed.2007.07.032
61 Panter, J. R., Jones, A. P., and van Sluijs, E. M. (2008). Environmental determinants of active travel in youth: a review and framework for future research. International Journal of Behavioural Nutrition and Physical Activity, 5, 34. DOI: http://doi.org/10.1186/1479-5868-5-34
62 Panter, J. R., Jones, A. P., van Sluijs, E. M. and Griffin, S. J. (2010). Attitudes, social support and environmental perceptions as predictors of active commuting behaviour in school children. Journal of Epidemiology & Community Health, 64, 41–48. DOI: http://doi.org/10.1136/jech.2009.086918
63 Pocock, T., Moore, A., Keall, M. and Mandic, S. (2018). Physical and spatial assessment of school neighbourhood built environments for active transport to school in adolescents from Dunedin (New Zealand). Health & Place, 55, 1–8. DOI: http://doi.org/10.1016/j.healthplace.2018.10.003
64 Pont, K., Ziviani, J., Wadley, D., Bennett, S. and Abbott, R. (2009). Environmental correlates of children’s active transportation: a systematic literature review. Health & Place, 15, 849–862. DOI: http://doi.org/10.1016/j.healthplace.2009.02.002
65 Porskamp, T., Ergler, C., Pilot, E., Sushama, P. and Mandic, S. (2019). The importance of social capital for young people’s active transport and independent mobility in rural Otago, New Zealand. Health & Place, 60, 102216. DOI: http://doi.org/10.1016/j.healthplace.2019.102216
66 Potoglou, D. and Arslangulova, B. (2017). Factors influencing active travel to primary and secondary schools in Wales. Transportation Planning and Technology, 40, 80–99. DOI: http://doi.org/10.1080/03081060.2016.1238573
67 Pucher, J. and Buehler, R. (2008). Making cycling irresistible: lessons from the Netherlands, Denmark and Germany. Transport Reviews, 28, 495–528. DOI: http://doi.org/10.1080/01441640701806612
68 Rahman, M. L., Moore, A., Smith, M., Lieswyn, J. and Mandic, S. (2020). A conceptual framework for modelling safe walking and cycling routes to high schools. International Journal of Environmental Research and Public Health, 17, 3318. DOI: http://doi.org/10.3390/ijerph17093318
69 Reimers, A. K., Jekauc, D., Peterhans, E., Wagner, M. O. and Woll, A. (2013). Prevalence and socio-demographic correlates of active commuting to school in a nationwide representative sample of German adolescents. Preventive Medicine, 56, 64–69. DOI: http://doi.org/10.1016/j.ypmed.2012.11.011
70 Robertson-Wilson, J. E., Leatherdale, S. T. and Wong, S. L. (2008). Social-ecological correlates of active commuting to school among high school students. Journal of Adolescent Health, 42, 486–495. DOI: http://doi.org/10.1016/j.jadohealth.2007.10.006
71 Sallis, J. F., Cervero, R. B., Ascher, W., Henderson, K. A., Kraft, M. K., and Kerr, J. (2006). An ecological approach to creating active living communities. Annual Review of Public Health. 27, 297–322. DOI: http://doi.org/10.1146/annurev.publhealth.27.021405.102100
72 Sjolie, A. N. and Thuen, F. (2002). School journeys and leisure activities in rural and urban adolescents in Norway. Health Promotion International, 17, 21–30. DOI: http://doi.org/10.1093/heapro/17.1.21
73 Smith, M., Hosking, J., Woodward, A., Witten, K., Macmillan, A., Field, A., Baas, P. and Mackie, H. (2017). Systematic literature review of built environment effects on physical activity and active transport—an update and new findings on health equity. International Journal of Behavioral Nutrition and Physical Activity, 14, 158. DOI: http://doi.org/10.1186/s12966-017-0613-9
74 Smith, M., Ikeda, E., Hinckson, E., Duncan, S., Maddison, R., Meredith-Jones, K., Walker, C. and Mandic, S. (2018). Results from New Zealand’s 2018 Report Card on Physical Activity for Children and Youth. Journal of Physical Activity and Health, 15, S390–S392. DOI: http://doi.org/10.1123/jpah.2018-0463
75 Spence, J. C. and Lee, R. E. (2003). Toward a comprehensive model of physical activity. Psychology of Sport and Exercise, 4, 7–24. DOI: http://doi.org/10.1016/S1469-0292(02)00014-6
76 Statistics New Zealand. (2018). ANZLIC metadata for urban rural 2019. Available from https://datafinder.stats.govt.nz/document/21473-anzlic-metadata-2018-urban-rural/ [Accessed 22 October 2019].
77 Statistics New Zealand. (2019). 2018 Census. Available from https://www.stats.govt.nz/2018-census/
78 Statistics New Zealand. (2020). Urban accessibility—methodology and classification. Wellington, NZ: Stats NZ Tatauranga Aotearoa. Available from https://www.stats.govt.nz/methods/urban-accessibility-methodology-and-classification [Accessed 19 October 2022].
79 Statistics New Zealand. (no date). Defining urban and rural New Zealand. Available from https://datafinder.stats.govt.nz/layer/105158-urban-rural-2021-generalised/ [Accessed 19 October 2022].
80 Stewart, O. (2011). Findings from research on active transportation to school and implications for Safe Routes to School programs. Journal of Planning Literature, 26, 127–150. DOI: http://doi.org/10.1177/0885412210385911
81 Sun, Y., Liu, Y. and Tao, F.-B. (2015). Associations between active commuting to school, body fat, and mental well-being: population-based, cross-sectional study in China. Journal of Adolescent Health, 57, 679–685. DOI: http://doi.org/10.1016/j.jadohealth.2015.09.002
82 Timperio, A., Ball, K., Salmon, J., Roberts, R., Giles-Corti, B., Simmons, D., Baur, L. A. and Crawford, D. (2006). Personal, family, social, and environmental correlates of active commuting to school. American Journal of Preventive Medicine, 30, 45–51. DOI: http://doi.org/10.1016/j.amepre.2005.08.047
83 Van Dyck, D., De Bourdeaudhuij, I., Cardon, G. and Deforche, B. (2010). Criterion distances and correlates of active transportation to school in Belgian older adolescents. International Journal of Behavioral Nutrition and Physical Activity, 7, 87. DOI: http://doi.org/10.1186/1479-5868-7-87
84 White, B., García Bengoechea, E., Spence, J. C., Coppell, K. J. and Mandic, S. (2021). Comparison of physical activity patterns across large, medium and small urban areas and rural settings in the Otago region, New Zealand. New Zealand Medical Journal, 134, 51–65.
85 Yang, Y., Diez Roux, A. V. and Bingham, C. R. (2011). Variability and seasonality of active transportation in USA: evidence from the 2001 NHTS. International Journal of Behavioral Nutrition and Physical Activity, 8, 96. DOI: http://doi.org/10.1186/1479-5868-8-96