Introduction
Transport impacts human health through multiple pathways. The latest review by Glazener et al. (2021) highlighted fourteen such pathways. These include four with beneficial effects (green spaces and aesthetics, physical activity, access and mobility independence) and ten with detrimental health effects (air pollution, road travel injuries, noise, stress, urban heat islands, contamination, climate change, community severance, restricted green space, blue space and aesthetics). Some of these pathways are better recognised and researched and have stronger evidence. Most health impact studies of transport have studied the three pathways of traffic injuries, air pollution and physical activity (Mueller et al., 2015), which are also the focus of this study.
With increasing income levels and urbanisation in many low- and middle-income countries (LMICs), populations are moving towards sedentary lifestyles. Growth in the use of private motorised modes has reduced travel-related physical activity and is projected to reduce further over the next decade of 2020–30 (Ng and Popkin, 2012). In Latin America and South Asia, physical activity levels are significantly lower than the global average (Guthold et al., 2018). Unmanaged growth in the transport sector and rapidly changing travel patterns have resulted in road death rates in LMICs that are three times higher than high-income countries and contribute 93% of the global road deaths (WHO, 2018). Emissions are increasing rapidly in many LMICs compared to Europe or the United States, where emissions have stabilised or are decreasing (Crippa et al., 2018). As expected, fine particulate matter (PM2.5) levels in East Asia, South Asia and parts of Sub-Saharan Africa have increased markedly over the past decades and are currently the highest in the world (Apte et al., 2018; Burnett and Cohen, 2020). These levels of pollution combined with a large population size result in the disproportionate share of premature mortality due to cardiovascular and respiratory diseases in LMICs (Burnett and Cohen, 2020). New evidence on the impact of PM2.5 pollution on infant mortality (Heft-Neal et al., 2018) and diabetes (Bowe et al., 2018), now included in the global burden of disease (GBD) estimates (Stanaway et al., 2018), have added to the health burden of PM2.5.
Thus, the transportation sector, through the pathways of physical activity, traffic injuries and air pollution, is likely a major contributor to rapidly increasing health burden in many LMICs. However, our understanding of this relationship is limited in the context of LMICs. A recent systematic review of studies that evaluated the health impact of transport interventions reported a scarcity of such studies in LMICs (Stankov et al., 2020). Another review of health impact assessment studies in LMICs found that most included air pollution as the only pathway, and few included other pathways, such as injuries and physical activity (Thondoo et al., 2021). In the past few years, there has been a growing interest in LMICs for health impact modelling that accounts for multiple exposure pathways, such as in Sao Paulo, Brazil (Sá et al., 2017), Accra, Ghana (Garcia et al., 2021), and Port Louis, Mauritius (Thondoo et al., 2020). Woodcock et al. (2009) produced one of the earliest such modelling studies for London, UK, and Delhi, India.
In this paper, we aim to fill this gap in the literature. We present a health impact model of transport for the megacity Delhi. We present the baseline health burden due to transport through the three exposure pathways of PM2.5 pollution, traffic injuries and physical activity for people 15 years or older. We also present physical activity and injury impacts resulting from future scenarios of travel patterns. The work presented in this paper was done as part of a doctoral thesis at Transportation Research and Injury Prevention Programme (now TRIP Centre), Indian Institute of Technology Delhi (Goel, 2017).
Data and methods
Case study city—Delhi
In 2011, Delhi had a population of 16.7 million and, along with its contiguous cities (see Figure 1), forms an agglomeration of 22.5 million, with a population density of 240 person per hectare (Goel and Guttikunda, 2015). In 2014, the annual average PM2.5 concentration was 146 ug/m3 (median: 111 ug/m3 and interquartile range: 66–374 ug/m3 (Goel, Gani et al., 2015)) and contributed to by multiple sectors (Guttikunda and Calori, 2013). With these concentration levels, Delhi is one of the most polluted cities in the world. In 2011, 21% of households owned at least one car, 38% owned at least one powered two-wheeler (PTW) and 30% owned at least one cycle. The ownership of vehicles has been rapidly growing. In the past decade (2009–2018), half a million cars and PTW have been registered every year. Public transportation includes intermediate public transportation (cycle rickshaws, three-wheeled motorised rickshaws (auto rickshaws), mini vans), buses and a metro rail system (Goel and Tiwari, 2016). We present a health impact analysis for 2014 as the baseline year, with a projected population of 18.3 million people 15 years or older.
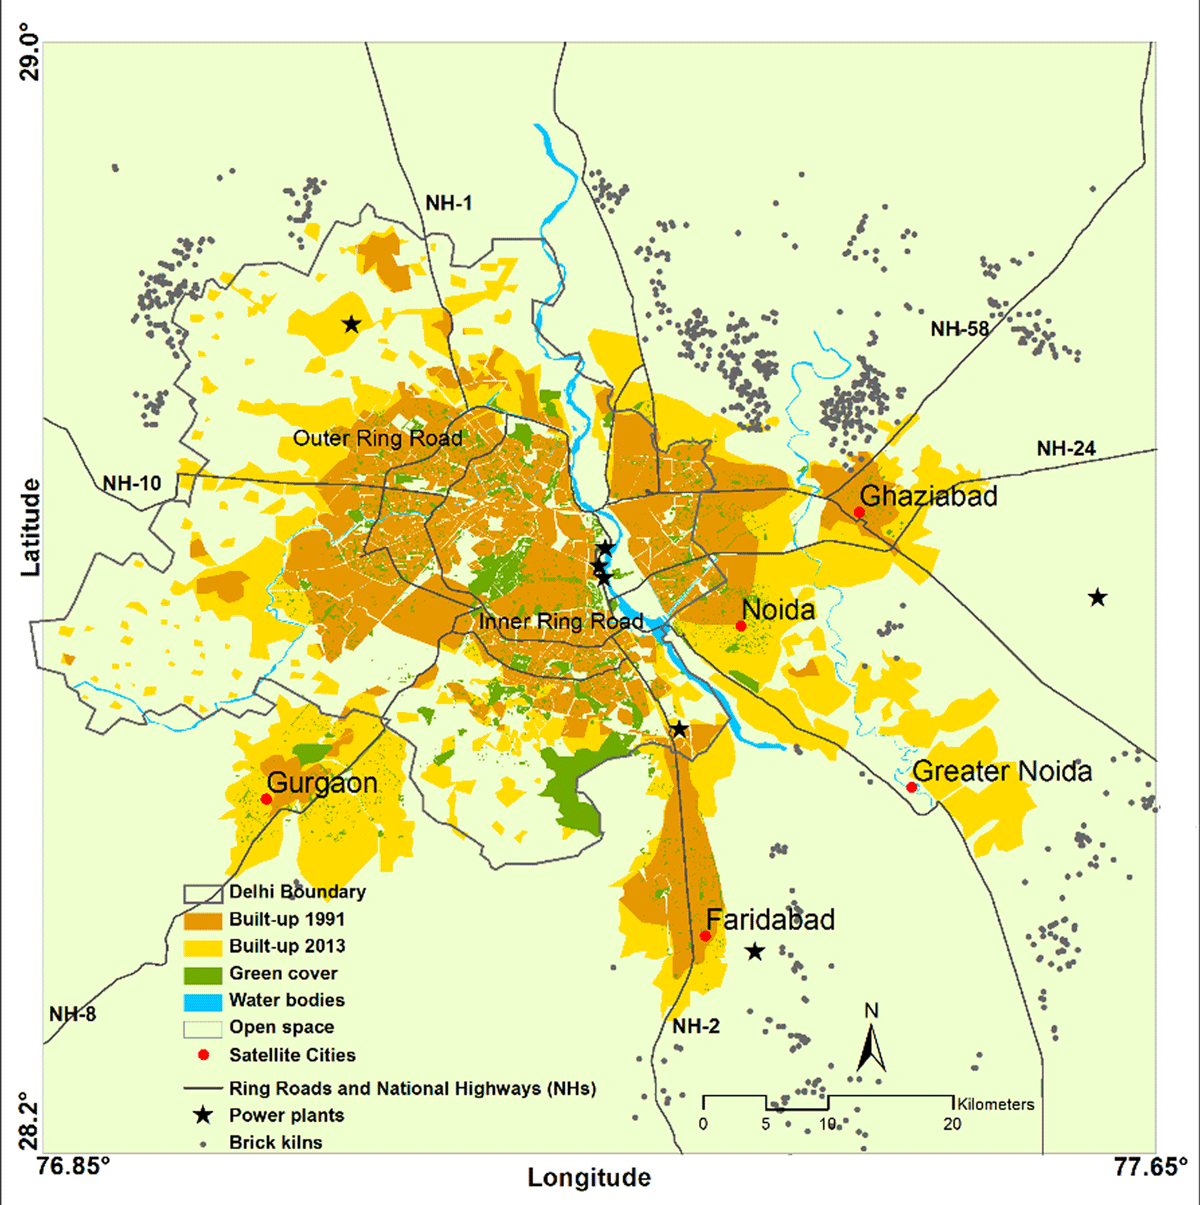
Delhi and its neighbouring cities.
Travel patterns
We conducted a household travel diary survey in Delhi in 2013 using a face-to-face interview approach. To sample households, we used a stratified (area-level income × distance from centre × four quadrants of the city) two-stage random sampling approach using a gridded (1 km × 1 km) population sampling frame (see Supplementary Information (SI) for details). We used a random walk approach for the final sample of households in the sampled grids. The average response rate was 65%, with significant variation across the sampled grids. We recorded the previous-day trip diary of all members of the households and used proxy responses for young children and those not available in the household at the time of interview. Post cleaning, we retrieved travel diaries from ~1,700 households (6,844 individuals). Table 1 presents mode share of trips for people aged 15 years or greater, considering only main modes and the gender distribution of trips within each mode. In a trip that involves multiple travel modes, for example, while using public transport, the main mode was the one used for the longest duration. Up to four in ten trips are by walking, and one quarter of all trips were made using various public transport modes—bus, metro, shared auto rickshaw, auto rickshaw and train. There are significant differences across the modes in terms of gender representation. Females contributed 33% of all trips and 19% of all travel distance, even though they comprise half the population. Gender representation has significant variation across the modes of transport. Females are most underrepresented in the use of cycling and PTW. India has one of the highest levels of gender inequality in the world (Black, 2016), and the work participation rate of women is among the lowest (Deshpande and Kabeer, 2019). Out-of-home mobility for work and for all travel needs is much lower among females than males (Census-India, 2016; Sanchez et al., 2017).
Mode share of trips for population older than 15 years.
| Main mode | Trip share | Mode share by gender | Distribution of trips within each mode | ||
|---|---|---|---|---|---|
| Male | Female | Male | Female | ||
| Walk | 42.5% | 32.4% | 63.4% | 51.3% | 48.7% |
| Cycle | 5.6% | 8.0% | 0.8% | 95.4% | 4.6% |
| Powered two-wheelers | 13% | 17.6% | 3.4% | 91.0% | 9.0% |
| Car | 9.1% | 11.2% | 4.8% | 82.9% | 17.1% |
| Cycle Rickshaw | 2.2% | 1.5% | 3.5% | 46.8% | 53.2% |
| Auto Rickshaw | 1.7% | 1.3% | 2.6% | 51.0% | 49.0% |
| Shared Auto Rickshaw | 1.7% | 1.6% | 1.9% | 64.0% | 36.0% |
| Bus | 19.4% | 21.9% | 14.4% | 75.8% | 24.2% |
| Metro | 3.5% | 3.3% | 4.1% | 62.4% | 37.6% |
| Train | 0.1% | 0.1% | 0.05% | 78.1% | 21.9% |
| Taxi | 1.2% | 1.2% | 1.1% | 71.0% | 29.0% |
| All modes | 100% | 100% | 100% | 33.0% | 67.0% |
Physical activity
We express intensity of travel physical activity as metabolic equivalent of task (MET) and the volume of activity as MET-h, which is the product of duration of activity and its corresponding MET value. For walking, we used MET values of 3.5 and 3.7 for females and males, respectively, and for cycling, a value of 6.8 METs was used for both sexes (Ainsworth et al., 2000; Woodcock, Givoni and Morgan, 2013). We included duration of walking and cycling that was done either as a main mode or as one of the stages of the trip, for example, walking to public transport stops. We estimated average weekly active travel time (walking and cycling) as 107 minutes and 156 minutes per capita for males and females, respectively. Most of this time was contributed by walking alone—99% for females and 84% for males. For females, 28% of their walking time was contributed to by public transport access trips, and for males, this share is 10%. The travel physical activity difference between the two groups widened more when expressed in volumes—6.3 MET-h for females and 10.9 MET-h for males per capita per week. We used weekly non-travel physical activity of 25.3 and 26.4 MET-h for males and females, respectively (Anjana et al., 2014).
Traffic injuries
We used case-level traffic fatality data reported by Delhi traffic police for 2010 through 2012 (Goel et al., 2018). We did not use police-reported traffic injury data due to high levels of underreporting of injury in Indian cities (Mohan, Tiwari and Bhalla, 2017). Instead, we used GBD-reported data (see below) to estimate DALYs corresponding to road deaths. During the 3-year period, there were 5,972 fatalities, equivalent to 11.9 deaths per 100,000 persons. Pedestrians, cyclists and PTWs contributed to 87% of all fatalities. In total, 38% of the fatalities occurred with freight vehicles (trucks) as the other vehicle involved, 37% with PTW and cars, and 17% with buses and other public transport modes. For 2014, the total number of deaths was estimated at 2,154, using the 2010–2012 death rate and projected population. Among the victims, 81% were males and 94% were 15 years or older. See SI for more details on traffic deaths and the road users involved.
Traffic emissions and population exposure
We estimated transport emissions using a bottom-up approach. We developed a dynamic time-trend annual emissions model that accounts for changes in vehicle technology, fuel use and emission standards (Goel and Guttikunda, 2015). To parameterise this model, we used data reported in literature, analysed secondary datasets and conducted primary surveys (Goel et al., 2015). In 2014, PTWs, cars, three-wheeled auto rickshaws and buses contributed 12%, 18%, 1% and 5% of transport PM2.5 emissions, respectively, and light- and heavy-duty freight vehicles contributed 64% of emissions. We updated the atmospheric transport modelling system (ATMoS) dispersion model for the Greater Delhi region (Guttikunda and Calori, 2013) with spatially and temporally resolved transport emissions. Using the model, we obtained modelled annual-average PM2.5 concentrations and source contributions at 1 km × 1 km resolution. To account for elevated exposure levels during on-road travel, we conducted a study to measure PM2.5 exposure in 11 transport microenvironments in Delhi that included all modes of transport and surface and underground public transportation stops (Goel et al., 2015). We used a portable, optical-sensor based, real-time PM2.5 monitor to measure exposure in different modes of transport. To estimate population-weighted PM2.5 exposure, we integrated spatio-temporal movement of population (using the travel survey) with spatio-temporal variation in modelled PM2.5 concentrations and accounted for on-road elevated exposure in corresponding transport microenvironments. The annual-average population-weighted concentrations was 118 ug/m3, accounting for 30% contribution from regional pollution observed in Indo-Gangetic plains (Guttikunda, Nishadh and Jawahar, 2019), and the population-weighted contribution of transport to PM2.5 concentration was 21%.
Health impact model
We developed a health impact model that used sex- and age-stratified aggregate population exposure of PM2.5 concentrations and sex-stratified exposure of travel physical activity. For traffic injuries, we developed a model to predict injury outcomes resulting from changes in travel patterns. The model uses road death counts classified into pairs of victim road user type and the other road user involved (e.g., for a pedestrian killed in a crash with car, pedestrian is victim and car is other road user). This data can be expressed as a two-way matrix (see SI). The model uses a non-linear relationship between travel exposure and injury risk within the ITHIM modelling framework (Woodcock, Givoni and Morgan, 2013; Sá et al., 2017; Garcia et al., 2021). We used the latest meta-analysis for parameterising non-linearity of the model (Elvik and Goel, 2020). To model health effects of PM2.5, we used integrated-exposure response functions (Burnett et al., 2018) for the six GBD-reported causes of deaths attributed to ambient PM2.5: ischemic heart disease (IHD), ischemic stroke, lower respiratory infections (LRI), lung cancer, chronic obstructive pulmonary disease (COPD) and diabetes (Stanaway et al., 2018). Out of these six, dose-response functions are age specific (5-year band) for IHD and stroke and common across ages for the other four. We modelled all-cause deaths (i.e., non-communicable diseases (NCD) and lower respiratory infections (LRI)) using the global exposure mortality model (GEMM) (Burnett et al., 2018) for sensitivity analysis. For physical activity, following the approach by Götschi et al. (2015), we modelled eight disease end-points that include breast and colon cancers in addition to the six diseases for PM2.5. We used the GBD India Compare online portal (Indian Council of Medical Research, Public Health Foundation of India and Evaluation, 2017) to access Delhi’s baseline year cause-specific deaths and DALYs stratified by sex and 5-year age groups (see SI).
Health impact assessments
We present the health burden estimates for the baseline year and health impacts resulting from future scenarios for people 15 years or older. For the baseline year (2014), we estimated the health burden attributed to PM2.5 pollution from transport and traffic injuries, and the health burden prevented due to baseline levels of travel physical activity. For PM2.5 we used counterfactual PM2.5 levels (2.4–5.8 ug/m3) as used in GBD (Burnett and Cohen, 2020). We used the attribution method to estimate transport’s share in health burden, which is calculated as the product of health burden attributed to total PM2.5 and the proportion of total PM2.5 pollution contributed by transport. For health benefits due to active travel, we calculated the difference between the prevented health burden from total physical activity and from physical activity excluding active travel. Total physical activity includes activity from both travel and non-travel domains. We used population aggregate exposure for modelling all three pathways.
For future scenarios, we adopted mode shares from three international settings: London (LDN), New York City (NYC), and Amsterdam (AMD). For the three scenarios, we estimated changes in health burden for the two pathways of injuries and physical activity. We did not conduct scenario modelling of air pollution as there are multiple anthropogenic sources of pollution in Delhi besides transport contributing significantly to overall PM2.5 concentrations, and there remains large uncertainties in terms of their future trajectories (Guttikunda and Calori, 2013). Because the scenario cities have negligible use of PTWs, the mode share of scenario car trips was distributed among cars and PTWs in the same ratio as in the baseline Delhi (see Table 2). Delhi has multiple national highways passing through the city that are often used by long-distance freight vehicles, which has been a major concern due to their contribution to worsening air pollution in the city (Goel and Guttikunda, 2015a). For each scenario, we assumed that vehicle kilometres travelled by freight vehicles will be reduced by half based on recommendations by the Environment Pollution Prevention and Control Authority (EPCA, 2015). The reduction will be achieved by restricting the entry of freight vehicles into the city that do not have Delhi as their destination. These changes in freight movement have been assumed to have no direct impact on physical activity. The injury model uses the ratio of vehicle kilometres travelled in the scenario to the baseline, which is 0.5 in the case of freight vehicles. The mode shares presented for Delhi in Table 2 are the mean values of the Monte Carlo simulations accounting for uncertainty in travel survey estimates. We assumed the total distance travelled across all modes remained constant between the baseline and the scenario. In the LDN and NYC scenarios, the reduction in travel time of walk and cycle was added to PTW and car. In the AMD scenario, the reduction in travel time of walk and public transport was added to PTW, car, and cycle. For each scenario, we used the same gender split of total travel time within a mode as the baseline.
Mode share and travel physical activity of baseline Delhi and scenario settings.
| Mode | Delhi | LDN | NYC | AMD |
|---|---|---|---|---|
| Walk | 44% | 30% | 39% | 23% |
| Cycle | 6% | 2% | 0.01% | 27% |
| Powered two-wheelers# | 12% | 22% | 17% | 16% |
| Car | 8% | 15% | 12% | 11% |
| Public transport and others | 31% | 31% | 31% | 23% |
| Total | 100% | 100% | 100% | 100% |
| Weekly travel physical activity from walking (MET-h) | ||||
| Male | 8.9 | 7.2 | 8.6 | 4.9 |
| Female | 6.9 | 5.9 | 6.5 | 5.9 |
| Weekly travel physical activity from cycling (MET-h) | ||||
| Male | 3.5 | 1.2 | 0.06 | 4.5 |
| Female | 0.2 | 0.09 | 0 | 2.6 |
| Total weekly travel physical activity (MET-h) | ||||
| Male | 12.4 | 8.4 | 8.7 | 9.4 |
| Female | 7.1 | 6.0 | 6.5 | 5.9 |
#For the scenarios cities, mode share of powered two-wheelers is obtained by apportioning car trips to cars and powered two-wheelers using the same relative distribution as baseline Delhi.
Results
Baseline and scenario health burden
Table 3 presents both the health burden of transport expressed in DALYs through the pathways of transport-related PM2.5 concentrations and traffic injuries and the prevented health burden due to travel physical activity. Traffic injuries result in a health burden about three times higher than PM2.5. The combined health burden due to two risk factors is equivalent to 6.9% of total NCDs plus injury burden in Delhi. Baseline levels of active travel prevent the equivalent of 40% of the combined health burden due to PM2.5 and injuries. Note that traffic-related PM2.5 health burden is 21% of the total PM2.5 burden. We can further classify traffic-related PM2.5 health burden into different vehicle types. Within transport, PTWs and cars contribute 30% of traffic-related PM2.5 emissions, buses and other road-based public transport contribute 6% and freight vehicles contribute 64%. This implies that 30% of 21% (i.e., 6%) of total PM2.5 can be attributed to personal motorised transport (PTWs and cars).
Cause-specific health burden of transport in DALYs for the baseline year (negative numbers indicate health burden prevented).
| Cause | Transport PM2.5 | Road traffic injuries | Travel physical activity |
|---|---|---|---|
| Ischemic heart disease | 29,216 | –35,624 | |
| Stroke | 2285 | –3458 | |
| Lung cancer | 2943 | ||
| Lower respiratory infections | 4631 | ||
| COPD | 15,336 | –18,700 | |
| Diabetes | 9193 | –24,022 | |
| Breast cancer | –1809 | ||
| Colon cancer | –784 | ||
| Alzheimer’s disease and other dementias | –916 | ||
| Major depressive disorder | –4311 | ||
| Traffic injuries | 170,860 | ||
| Total | 63,600 | 170,860 | –89,620 |
Figure 2 presents the increase in health burden from traffic injuries and changes in travel physical activity. Use of motorised transport increased and travel physical activity reduced in all scenarios (see Table 2), resulting in additional health burden due to the two risk factors. Injuries of pedestrians and motorcyclists contribute the most to injuries in the LDN and NYC scenarios, while in the AMD scenario, cycle injuries are also prominent. Within each scenario, additional burden from injuries is much greater than the additional burden from reduced physical activity. Because the burden of traffic injuries is almost the same across the three scenarios, the difference across scenarios is dominated by changes in physical activity. The increase in injury burden is almost doubled in each scenario if the baseline levels of freight use continue.
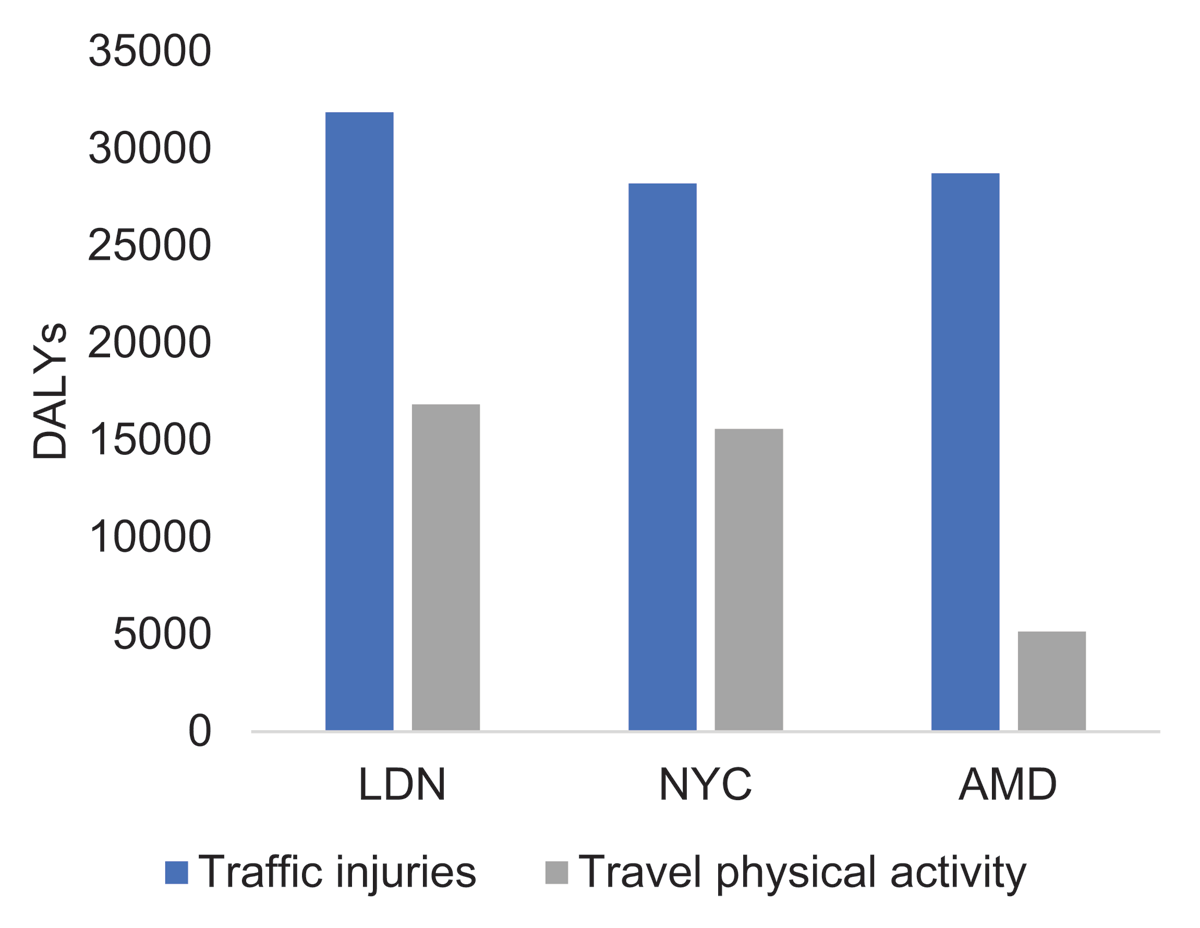
Increase in health burden from injuries and travel physical activity for scenarios of Delhi’s travel patterns based on London, New York City and Amsterdam.
Discussion
We estimated the health burden of transport in Delhi from the three pathways of PM2.5 (pollution, traffic injuries and physical activity). For future scenarios of travel patterns, we estimated health impacts due to changes in injuries and physical activity. We found that despite extremely high levels of pollution in Delhi, the health burden due to traffic-related PM2.5 is about one third of the burden due to traffic injuries. This is partly because transport is only a part of the overall air pollution problem, contributing to one fifth of all PM2.5 pollution in Delhi. The other prominent sources include industry, construction activities, waste burning and residential biomass burning (Guttikunda and Calori, 2013). And partly because traffic injuries are more common among the younger population while diseases caused by PM2.5 have greater prevalence among the older population. Death and disability of young people due to injuries result in greater number of life years lost and years lived in disability. Besides the age patterns, the per capita traffic death rate in Delhi is about five times as high as the median death rate in European cities, which are among the safest in the world (ITF, 2019).
We found that prevented health burden due to baseline levels of active travel is greater than the health loss due to traffic-related PM2.5 and about half as large as health loss due to traffic injuries. The preventive effect of physical activity underscores the potential loss in health that may result from a future mode shift away from active travel and public transport. In scenarios based on mode shares of London and New York City, an increase in health burden due to reduced physical activity (16,800 and 15,500 DALYs, respectively) is close to the contribution of all cars plus PTWs to the PM2.5 health burden in the baseline (30% of 63,600 = 19,080 DALYs). In other words, even if a part of active travel is replaced by motorised modes in the future, it can easily negate benefits achieved from cleaner transport, for example, electric vehicles. Our results indicate that a mode shift from walking and cycling to motorised transportation should be recognised for its unobserved, and potentially far greater, effect on population health through reduced physical activity.
We found that walking to public transport is a significant contributor to overall physical activity, more so among females who have greater dependence on public transport than males. Thus, use of public transport can improve health by providing an opportunity to engage in active travel for trips that are too long for walking or cycling. This finding has also been reported in multiple international settings (Goel et al., 2022; Rissel et al., 2012). Thus, public transport is an important intervention that should be included within the broad framework of active travel policies in cities.
Our study adds to the growing literature on health impact modelling in LMICs. Our findings are in line with similar work done in other LMIC cities. For example, for Accra, Ghana, Garcia et al. (2021) reported that traffic injuries may negate benefits from greater physical activity in scenarios with greater use of active travel. This is similar to the dominance of injury burden that we found in future scenarios for Delhi. The health impact modelling study by Woodcock et al. (2009) for London and Delhi reported greater health benefits from a shift to active travel than from cleaner motor vehicles, which is again similar to our findings above.
From 2014, the baseline year of our study, to 2019, there have been 650,000 cars plus PTWs registered every year. For a population of 19 million and an average household size of five (Delhi Police, 2020), this implies 17 new vehicles for every 100 households every year (assuming each new vehicle is for a unique household). The policy responses to this rapid growth in vehicles have often been short-sighted in their approach and even detrimental to sustainable and active transport (Goel and Pant, 2016). For example, to reduce vehicular pollution, there is large focus on technological measures, such as improvement of emission standards (Goel and Guttikunda, 2015b) and subsidising electric vehicles (Transport Department, 2020), while there are no polices in place to discourage ownership or use of vehicles. To reduce congestion, grade-separated junctions are constructed and roads are widened, and these have been found to substantially increase the risk of pedestrians and other vulnerable road users (Goel et al., 2018; Goel and Pant, 2016; Khatoon et al., 2013). With the stated aim of “improving safety” for pedestrians (Delhi Police, 2020), foot-over-bridges are installed to replace at-grade signalised crossing (Rankavat and Tiwari, 2015), ignoring access for the disabled and elderly and increasing barriers for walking in general.
Because pollution levels can be measured and injuries can be observed, they get disproportionate attention in transport decision making. With no processes in place to measure travel patterns (as household surveys or volume counts) on a regular basis, the impact of these policies on reducing active travel remains underappreciated and is only inferred from rising levels of vehicle ownership. Our study underscores that air pollution, traffic injuries and physical activity are interrelated. As recommended by Salvo et al. (2021), there is a need to adopt a “health in all policies” approach to transportation engineering and planning. Such an approach will result in “transportation systems that prioritize active travel through widespread and safe walking, cycling, and public transit infrastructure” (Salvo et al. 2021).
In India, as in many LMICs, growth in private motorised vehicles is often treated as an inevitable outcome of rising income levels. However, this is an incomplete diagnosis and underplays the contribution of policies, such as those discussed above, that are complicit in encouraging greater use of vehicles and moving people away from active travel or public transport. In the latest climate change conference (COP26), India has pledged net-zero emissions by 2070 (Vaughan, 2021). To attain this ambitious goal, reduction of in-use emissions will not be enough, and there is also a need to phase out production of vehicles while minimising their use. For policy makers, it is important to envision an alternative trajectory of development that does not include continued usage and growth in the number of personal motor vehicles.
Additional File
The additional file for this article can be found as follows:
Detailed methodology. DOI: https://doi.org/10.16997/ats.1231.s1
Competing Interests
The authors have no competing interests to declare.
Authors Contributions
All authors conceptualised the study. RG led the data collection, analysis, and writing with inputs from SG and GT.
References
1 Ainsworth, BE, et al. 2000. Compendium of physical activities: An update of activity codes and MET intensities. Medicine and Science in Sports and Exercise, 32(9 SUPPL.). DOI: http://doi.org/10.1097/00005768-200009001-00009
2 Anjana, RM, et al. 2014. Physical activity and inactivity patterns in India - results from the ICMR-INDIAB study (Phase-1) [ICMR-INDIAB-5]. International Journal of Behavioral Nutrition and Physical Activity, 11(1): 1–11. DOI: http://doi.org/10.1186/1479-5868-11-26
3 Apte, JS, et al. 2018. Ambient PM2.5 Reduces Global and Regional Life Expectancy. Environmental Science and Technology Letters, 5(9): 546–551. DOI: http://doi.org/10.1021/acs.estlett.8b00360
4 Black, CF. 2016. Global Gender Gap Report. In: Encyclopedia of Family Studies (Issue March). DOI: http://doi.org/10.1002/9781119085621.wbefs350
5 Bowe, B, et al. 2018. The 2016 global and national burden of diabetes mellitus attributable to PM 2•5 air pollution. The Lancet Planetary Health, 2(7): e301–e312. DOI: http://doi.org/10.1016/S2542-5196(18)30140-2
6 Burnett, R and Cohen, A. 2020 Relative risk functions for estimating excess mortality attributable to outdoor PM2.5 air pollution: Evolution and state-of-the-art. Atmosphere, 11(6): 1–13. DOI: http://doi.org/10.3390/atmos11060589
7 Burnett, R, et al. 2018. Global estimates of mortality associated with longterm exposure to outdoor fine particulate matter. Proceedings of the National Academy of Sciences of the United States of America, 115(38): 9592–9597.
8 Census-India. 2016. B–28 “Other Workers” by distance from residence to place of work and mode of travel to place of work – 2011 (India/states/UTs/district). Census of India 2011.
9 Crippa, M, et al. 2018. Gridded emissions of air pollutants for the period 1970–2012 within EDGAR v4.3.2. Earth System Science Data, 10(4): 1987–2013. DOI: http://doi.org/10.5194/essd-10-1987-2018
10 Delhi Police. 2020. Road accidents in Delhi 2019. Available from https://delhitrafficpolice.nic.in/sites/default/files/uploads/2020/Road-accident-in-delhi-2019.pdf.
11 Deshpande, A and Kabeer, N. 2019. (In)visibility, care and cultural barriers: the size and shape of women’s work in India. Available from http://eprints.lse.ac.uk/100992/.
12 EPCA. 2015. Report on strategies to reduce air pollution from trucks entering and leaving Delhi. Delhi, India. Available from https://www.epca.org.in/EPCA-Reports1999-1917/Report-no.48.pdf.
13 Garcia, L, Johnson, R, Johnson, A, Abbas, A, Goel, R, Tatah, L, Damsere-Derry, J, Kyere-Gyeabour, E, Tainio, M, de Sá, TH and Woodcock, J. 2021. Health impacts of changes in travel patterns in Greater Accra Metropolitan Area, Ghana. Environment International, 155: 106680. DOI: http://doi.org/10.1016/j.envint.2021.106680
14 Glazener, A, Sanchez, K, Ramani, T, Zietsman, J, Nieuwenhuijsen, MJ, Mindell, JS, Fox, M and Khreis, H. 2021. Fourteen pathways between urban transportation and health: A conceptual model and literature review. Journal of Transport & Health, 21: 101070. DOI: http://doi.org/10.1016/j.jth.2021.101070
15 Goel, R. 2017. Public health effects of urban transport in Delhi, Transportation Research and Injury Prevention Programme. Indian Institute of Technology Delhi. Available from https://www.dropbox.com/s/pzef6ug89l3v7cq/2017_goel_thesis.pdf?dl=0.
16 Goel, R and Guttikunda, SK. 2015a. Evolution of on-road vehicle exhaust emissions in Delhi. Atmospheric Environment, 105: 78–90. DOI: http://doi.org/10.1016/j.atmosenv.2015.01.045
17 Goel, R and Guttikunda, SK. 2015b. Role of urban growth, technology, and judicial interventions on vehicle exhaust emissions in Delhi for 1991–2014 and 2014–2030 periods. Environmental Development, 14: 6–21. DOI: http://doi.org/10.1016/j.envdev.2015.03.002
18 Goel, R and Pant, P. 2016. Vehicular pollution mitigation policies in Delhi. Economic and Political Weekly, 51(9): 41–45.
19 Goel, R and Tiwari, G. 2016. Access-egress and other travel characteristics of metro users in Delhi and its satellite cities. IATSS Research, 39(2): 164–172. DOI: http://doi.org/10.1016/j.iatssr.2015.10.001
20 Goel, R, Gani, S, et al. 2015. On-road PM2.5 pollution exposure in multiple transport microenvironments in Delhi. Atmospheric Environment, 123: 129–138. DOI: http://doi.org/10.1016/j.atmosenv.2015.10.037
21 Goel, R, Guttikunda, SK, et al. 2015. Benchmarking vehicle and passenger travel characteristics in Delhi for on-road emissions analysis. Travel Behaviour and Society, 2(2): 88–101. DOI: http://doi.org/10.1016/j.tbs.2014.10.001
22 Goel, R, Jain, P and Tiwari, G. 2018. Correlates of fatality risk of vulnerable road users in Delhi. Accident Analysis and Prevention, 111(November 2017): 86–93. DOI: http://doi.org/10.1016/j.aap.2017.11.023
23 Goel, R, Oyebode, O, Foley, L, Tatah, L, Millett, C and Woodcock, J. 2022. Gender differences in active travel in major cities across the world. Transportation, 1–17. DOI: http://doi.org/10.1007/s11116-021-10259-4
24 Götschi, T. et al. 2015. Contrasts in active transport behaviour across four countries: How do they translate into public health benefits? Preventive medicine, 74: 42–48. DOI: http://doi.org/10.1016/j.ypmed.2015.02.009
25 Guthold, R, et al. 2018. Worldwide trends in insufficient physical activity from 2001 to 2016: a pooled analysis of 358 population-based surveys with 1•9 million participants. The Lancet Global Health, 6(10): e1077–e1086. DOI: http://doi.org/10.1016/S2214-109X(18)30357-7
26 Guttikunda, SK and Calori, G. 2013. A GIS based emissions inventory at 1 km × 1 km spatial resolution for air pollution analysis in Delhi, India. Atmospheric Environment, 67: 101–111. DOI: http://doi.org/10.1016/j.atmosenv.2012.10.040
27 Guttikunda, SK, Nishadh, KA and Jawahar, P. 2019. Air pollution knowledge assessments (APnA) for 20 Indian cities. Urban Climate, 27: 124–141. DOI: http://doi.org/10.1016/j.uclim.2018.11.005
28 Heft-Neal, S, et al. 2018. Robust relationship between air quality and infant mortality in Africa. Nature, 559(7713): 254–258. DOI: http://doi.org/10.1038/s41586-018-0263-3
29 Indian Council of Medical Research, Public Health Foundation of India and I. for H. and Evaluation, M. and GBD India. 2017. Compare Data Visualization, New Delhi: ICMR, PHFI, and IHME. Available from http://vizhub.healthdata.org/gbd-compare/india.
30 ITF. 2019. Road Safety in European Cities: Performance Indicators and Governance Solutions.
31 Khatoon, M, Tiwari, G and Chatterjee, N. 2013. Impact of grade separator on pedestrian risk-taking behavior. Accident Analysis & Prevention, 50: 861–870. DOI: http://doi.org/10.1016/j.aap.2012.07.011
32 Mohan, D, Tiwari, G and Bhalla, K. 2017. Road Safety in India: Status Report 2017. New Delhi, India: Transportation Research & Injury Prevention Programme, Indian Institute of Technology Delhi.
33 Mueller, N, Rojas-Rueda, D, Cole-Hunter, T, de Nazelle, A, Dons, E, Gerike, R, Götschi, T, Int Panis, L, Kahlmeier, S and Nieuwenhuijsen, M. 2015. Health impact assessment of active transportation: A systematic review. Preventive Medicine, 76: 103–114. DOI: http://doi.org/10.1016/j.ypmed.2015.04.010
34 Ng, SW and Popkin, BM. 2012. Time use and physical activity: a shift away from movement across the globe. Obesity Reviews, 13(8): 659–680. DOI: http://doi.org/10.1111/j.1467-789X.2011.00982.x
35 Rankavat, S and Tiwari, G. 2015. Association between built environment and pedestrian fatal crash risk in Delhi, India. Transportation Research Record, 2519(1): 61–66. DOI: http://doi.org/10.3141/2519-07
36 Rissel, C, Curac, N, Greenaway, M and Bauman, A. 2012. Physical activity associated with public transport use-a review and modelling of potential benefits. International Journal of Environmental Research and Public Health, 9(7): 2454–2478. DOI: http://doi.org/10.3390/ijerph9072454
37 Sá, TH de, Tainio, M, Goodman, A, Edwards, P, Haines, A, Gouveia, N, Monteiro, C and Woodcock, J. 2017. Health impact modelling of different travel patterns on physical activity, air pollution and road injuries for São Paulo, Brazil. Environment International, 108(August): 22–31. DOI: http://doi.org/10.1016/j.envint.2017.07.009
38 Salvo, D, Garcia, L, Reis, RS, Stankov, I, Goel, R, Schipperijn, J, Hallal, PC, Ding, D and Pratt, M. 2021. Physical Activity Promotion and the United Nations Sustainable Development Goals: Building Synergies to Maximize Impact. 1–18. DOI: http://doi.org/10.1123/jpah.2021-0413
39 Sanchez, M, Ambros, A, Salmon, M, Bhogadi, S, Wilson, RT, Kinra, S, Marshall, JD and Tonne, C. 2017. Predictors of daily mobility of adults in peri-urban south India. International Journal of Environmental Research and Public Health, 14(7): 1–16. DOI: http://doi.org/10.3390/ijerph14070783
40 Stanaway, JD, et al. 2018. Global, regional, and national comparative risk assessment of 84 behavioural, environmental and occupational, and metabolic risks or clusters of risks for 195 countries and territories, 1990–2017: A systematic analysis for the Global Burden of Disease Study 2017. The Lancet, 392(10159): 1923–1994.
41 Stankov, I, et al. 2020. A systematic review of empirical and simulation studies evaluating the health impact of transportation interventions. Environmental Research, 186(August 2019): 109519. DOI: http://doi.org/10.1016/j.envres.2020.109519
42 Thondoo, M, Goel, R, Tatah, L, Naraynen, N, Woodcock, J and Nieuwenhuijsen, M. 2021. The Built Environment and Health in Low- and Middle-Income Countries: a Review on Quantitative Health Impact Assessments. Current Environmental Health Reports. DOI: http://doi.org/10.1007/s40572-021-00324-6
43 Thondoo, M, Mueller, N, Rojas-Rueda, D, de Vries, D, Gupta, J and Nieuwenhuijsen, MJ. 2020. Participatory quantitative health impact assessment of urban transport planning: A case study from Eastern Africa. Environment International, 144: 106027. DOI: http://doi.org/10.1016/j.envint.2020.106027
44 Transport Department. 2020. Delhi Electric Vehicles Policy, 2020. Available from https://transport.delhi.gov.in/sites/default/files/All-PDF/Delhi_Electric_Vehicles_Policy_2020.pdf.
45 Vaughan, A. 2021. India’s pledge on net zero. New Scientist, 252(3359): 10. DOI: http://doi.org/10.1016/S0262-4079(21)01952-7
46 WHO. 2018. Global status report on road safety 2018. World Health Organization.
47 Woodcock, J, Edwards, P, Tonne, C, Armstrong, BG, Ashiru, O, Banister, D, Beevers, S, Chalabi, Z, Chowdhury, Z and Cohen, A. 2009. Public health benefits of strategies to reduce greenhouse-gas emissions: urban land transport. The Lancet, 374(9705): 1930–1943. DOI: http://doi.org/10.1016/S0140-6736(09)61714-1
48 Woodcock, J, Givoni, M and Morgan, AS. 2013. Health impact modelling of active travel visions for England and Wales using an Integrated Transport and Health Impact Modelling Tool (ITHIM). PLoS One, 8(1): e51462. DOI: http://doi.org/10.1371/journal.pone.0051462