
1. Introduction
1.1 Background and rationale
In the UK, the National Cycle Network (NCN) provides a major backbone for cycling and wheeling across both urban and rural areas. Covering over 16,000 miles of signed and managed routes, the NCN is used for both leisure and utility cycling, significantly with 5000 miles of the network completely traffic free. It comprises shared use paths, segregated cycle lanes, streets with low traffic, and off-road tracks, all with signage. The “on-road” sections typically are found in rural areas, whilst the traffic free routes are found in urban areas, but there is much variation in the quality and type of provision (Sustrans, 2023). However, contrary to modern design principles (Department for Transport, 2020), much of both the NCN and wider UK cycle network contain barriers. These barriers, often in the form of physical obstructions, are discriminatory against a host of active modes, such as wheelchairs, tri-cycles and many adapted cycles (Sustrans, 2020; Wheels for Wellbeing, 2022).
Historically, barriers have been implemented on active travel corridors due to planning stipulations at the time of construction (BikeBiz, 2016), often as a result of perceived issues of crime, such as trespass by motorcycle riders, as well to prevent cyclists from approaching intersections or tight passages on the network at a high speed. The design of such barriers, however, often focuses on reducing the passable width of the infrastructure or even requiring the need to dismount a cycle. This has led to the unintended consequence of rendering the routes inaccessible for users who cannot pass through the barrier due to their choice of cycle, be that through requirements as a disabled person, or simply a choice based on utility and function.
Currently, over 7000 barriers have been identified on the network in the UK, roughly equating to a barrier every 0.4 miles. These barriers have been identified as part of a volunteered geographic information (VGI) initiative curated by Sustrans, now renamed The Walk Wheel Cycle Trust, an active travel and sustainable mobility charity organisation, who are custodians of the network (Sustrans, 2018). Sustrans aims to remove all barriers on the NCN by 2040, with the target of making the network accessible and useable for all. Progress remains slow, however, with no established methods for determining which of these barriers are the highest priority for removal. This has led to sporadic and often uncoordinated work on network improvements, and therefore likely has not obtained the highest potential gains in access for users. To tackle this, this paper presents a decision support tool to assist the prioritisation of the barrier identification and removal process, with the goal of enabling a greater rate of change in the ability for non-standard cycle users to access and benefit from the existing NCN in the UK.
1.2 Access to active travel networks
Burns, Oram and Claris (2019) state that 31% of disabled people would like to start cycling but potential users are faced with limitations in accessing active travel infrastructure, such as barriers on routes. Transport for London (2012) asked survey respondents whether they could ride a bike: 70% of disabled people responded “Yes”, highlighting that the issue lies not with ability to move via cycling but with the opportunity to use cycling as a mode of transport. In the UK, there is a low rate of observed cycling per week for people with disabilities of 9%, compared with 17% for non-disabled people (Cycling UK, 2025). Moreover, despite cycling forming a key part of physical activity, transport and health promotion for disabled people, it is largely not catered for in active travel planning in the UK (Inckle, 2020). Cycling can be easier for disabled people than other modes such as walking or using public transport, and thus accessing cycling infrastructure is an important component of daily living (Inckle, 2022; Andrews and Clement, 2021). However, cycling continues to be difficult or unfeasible as a result of challenging and unaccommodating infrastructure.
These issues commonly relate to the prevalence of physical barriers that do not allow a user to continue onto the designated foot/cycle path (Figure 1), particularly if using a non-standard cycle. Roadblocks, barriers and gates are frequently too narrow for use by many users (Orving et al., 2019; Clayton and Parkin, 2016; Cox and Bartle, 2020) and Wheels for Wellbeing found inaccessible infrastructure is the greatest barrier to cycling for disabled cyclists (Wheels for Wellbeing, 2021). Design standards from the Department for Transport, the UK government department responsible for transport policy, mandate that corrections must be made where effective widths are below 1.5m, however audit data from Sustrans (Figure 2) indicates that over 5000 barriers still exist across the UK with a critical width lower than this (Department for Transport, 2020).
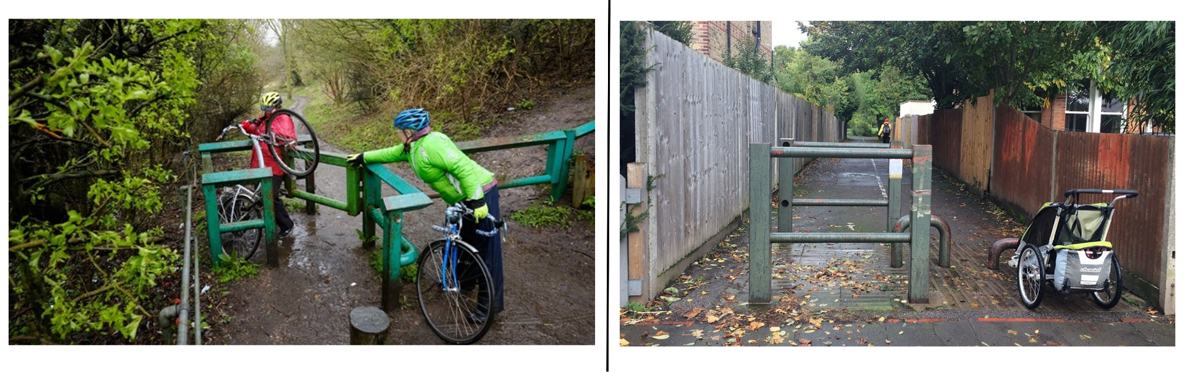
Figure 1: Cyclists struggle to pass through a barrier on the NCN (left); and pushchair unable to access footpath due to barrier obstructions (right). The barrier to the footpath (left of right image) is too tight to fit past, whilst the barrier to the cycleway (right of right image) is designed only for two-wheel cycles. This barrier type, known as a kissing gate, requires a user to manoeuvre around a heavy swinging gate which is not designed to accommodate cycles, wheelchairs or other mobility devices. Photos: Sustrans, 2020 and 2021b.
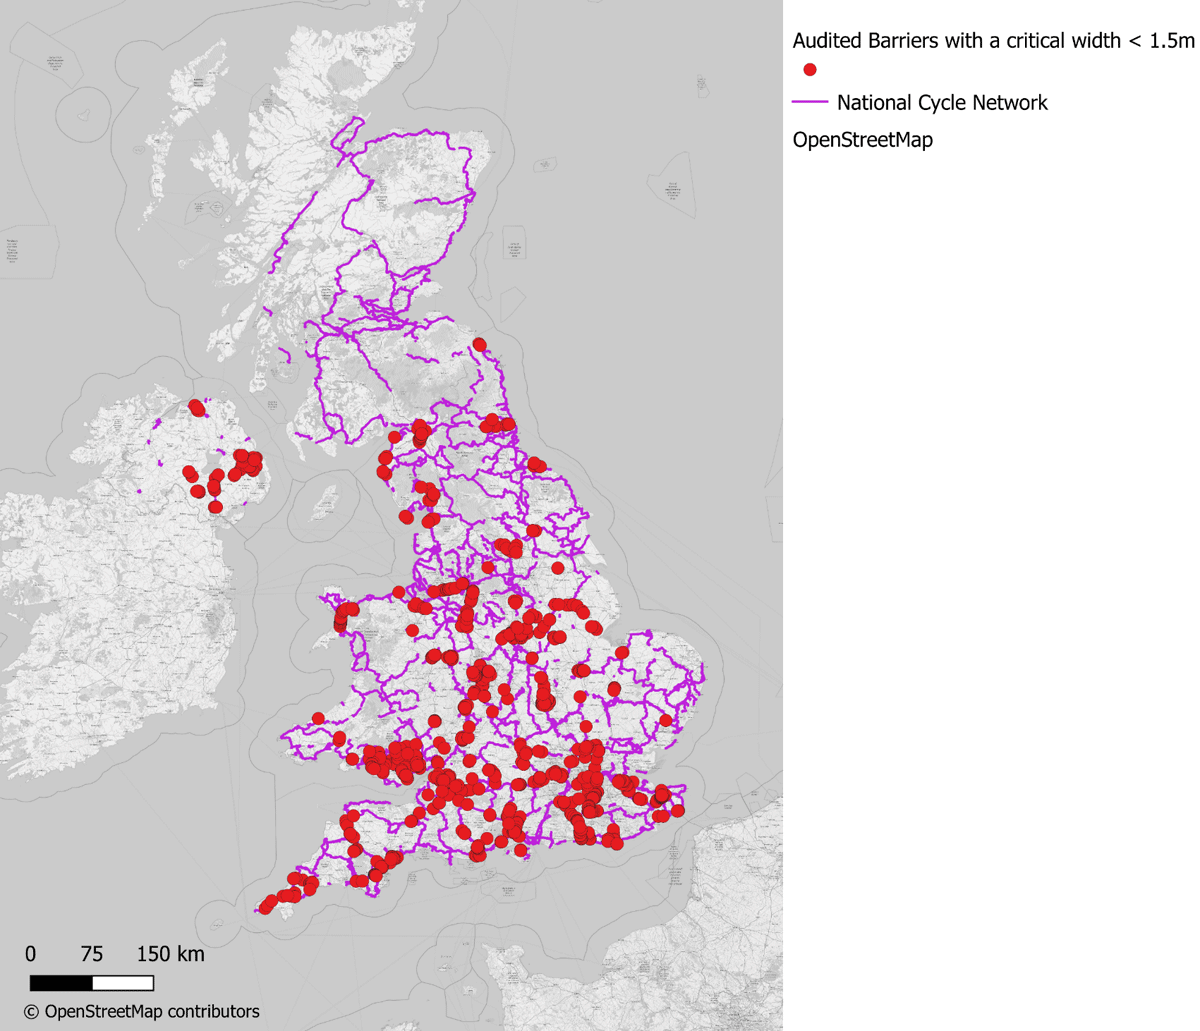
Figure 2: Audited barriers with critical widths less than 1.5m across the UK’s National Cycle Network.
Barriers were originally implemented predominantly as a measure against anti-social behaviour, such as the illegal use of motorbikes on traffic-free routes. Crime is often the source of conflict in the context of barriers on cycle networks, as the perceived benefit of keeping crime away is seen to outweigh the benefits of allowing all users of the network to use the routes fully (Brice, 2020). Intervention and monitoring studies have highlighted, however, that the perceived level of crime is far higher than the reality on the ground. In a barrier redesign/removal trial in York over the period of two months, for every illegal motorised trip on the network, 22,212 legitimate trips occurred (Sustrans, 2024). Through video recording at the site of barrier removal, a total of four illegal motorised trips were recorded, while 45 additional trips per day by active modes were recorded that could not have taken place prior to the changes (due to the barriers now being accessible for a wider number of users, allowing riders of adapted cycles to pass through). This study also interviewed users and found that roughly half of all users knew of people who could now use the routes who would have previously been excluded due to their use of non-standard cycle or other mobility aid, meaning access would not be possible.
Barriers vary in their impacts as a result of their spatial location, their inherent design and the user interacting with them. The form of adapted cycles or mobility aids can have impacts on which barriers are passable or not (Cox and Bartle, 2020). For example, a tri-cycle may struggle to pass through a narrow “A-frame” barrier but be able to pass through a chicane. Where the barrier occurs can also be of importance. As highlighted by Larrington-Spencer (2025), barriers can restrict access to what would be good quality infrastructure, if the user was able to pass through them. Living within close vicinity to such a situation prevents cycling to a much wider area. Users are essentially in a geographic lottery as to if they can access cycling or not locally, regardless of how committed to cycling they are.
1.3 Measuring barrier impacts
When measuring access within a cycle network, a typical analysis will look to assess the quantity and quality of the network and the destinations available (Lowry and Loh, 2017). These analyses, however, do not tend to consider that some portions of network may not be accessible by some user groups, instead calculating access only for the average user.
Some studies look to address this by measuring the impact of barriers on networks. Direct barrier effects have been defined as the impacts created by transport infrastructure on physical access to activities for people (and opportunities for business) (van Eldijk et al., 2020). The effects of a barrier on a given area have been quantified by many methods using geospatial analysis, commonly including at least one of four measurements: travel time or distance, amenity choice, catchment size, and service efficiency (van Eldijk et al., 2020; Reyier, 1987; Jarlebring et al., 2002; Clark, 1991; Anciaes, 2013).
Travel time or distance requires a cut-off point to be defined. Both et al. (2022) observed cycling for 6 kilometres at a speed of 13 km/h to be a distance citizens are willing to cycle comfortably. This figure, however, only relates to regularly commuting adults; a reduction in both average speed and distance is to be expected for people with additional needs with respect to cycling.
Studies of barrier impacts are usually applied to dense street networks with high interconnectivity (Anciaes, Jones and Mindell, 2016). In contrast, the NCN typically functions as linear connections between locations. Without any alternative routes, the impact of a barrier is more absolute: a single impassable barrier can render an entire section of the network inaccessible to certain users. Whilst real-world journeys may be able to deviate from the NCN route, the intention of a national cycle network is to enable safe and convenient travel by cycle along its entirety, thus travel along the NCN between barriers is the focus of this paper.
Furthermore, there are different factors that are important to disabled cyclists, compared with the factors used in previous barrier impact studies. Within prioritisation studies in which multiple factors must be considered, the relative importance of each factor is unlikely to be equal. The process of determining the importance of each factor originates from the research area of Multi-Criteria Decision Making (MCDM). MCDM evaluates the relative importance of each factor in a pairwise matrix to provide a weighting by which each factor is multiplied (Stojčić et al., 2019). Many MCDM approaches are also prevalent in studies relating to geospatial problems. Most commonly, analytical hierarchy process (AHP) is used, particularly in studies of suitability analysis and GIS (Ohta et al., 2007; Panahi, Rezaie and Meshkani, 2013; Sałabun, Wątróbski and Shekhovtsov, 2020). Conceived by Saaty (1987), AHP is a commonly implemented MCDM approach to reduce multi-factor metrics to a set of pairwise comparisons. In this pairwise comparison, metrics are traded off against each other and their relative importance is judged using a numerical scale that indicates how much more important one factor is over another. The AHP method has been used effectively in GIS studies, as shown in the research from Ohta et al., (2007) and Panahi, Rezaie and Meshkani, (2013).
1.4 Research goals and objectives
Based on the above literature, it is evident that research is yet to provide a comprehensive bridge between the “physical” accessibility relating to ability to move through a space, and the “transport” accessibility relating to the ability to reach opportunities. There is a particular gap in considering the impact of physical barriers in active travel networks on the accessibility of those networks to different users. This research aims to fill this gap by using both types of accessibility to score the impacts of physical barriers on the ability of users to reach a given opportunity.
Furthermore, whilst some studies have shown the impact of barriers (van Eldijk et al., 2020), to the authors’ knowledge no study has attempted to rank barriers in terms of removal priority. Given the potential benefits of unlocking key sections of active travel infrastructure for all, it is surprising that little research has attempted to quantify where barriers have the biggest impact on accessibility. Considering the lack of knowledge regarding the prioritisation of barrier removal, the overarching research question for this paper can therefore be defined as: How can barriers be evaluated for removal priority within the context of accessibility for all?
2. Methods and data
2.1 Study area and datasets
Research has been conducted in the city region of York, and rural county region of Pembrokeshire. York and Pembrokeshire were chosen for the high prevalence of barriers within their respective areas, and for their distinct characteristics (Table 1). York is a populated city region with a relatively high cycling rate and represents an urban cycling context. Pembrokeshire presents the rural case as the area is sparsely populated and use of cycling for transport is low. The regions covered by both study areas can be seen in Figure 3.
Table 1: Study area characteristics.
| Study area | York | Pembrokeshire |
| Location | Northern England | South-West Wales |
| Region type | City | Rural |
| Population density | 775 citizens per km2 | 78 citizens per km2 |
| Propensity to use active travel | High | Low |
| Number of audited barriers | 37 | 78 |
| Area size | 271.94 km2 | 1,590 km2 |
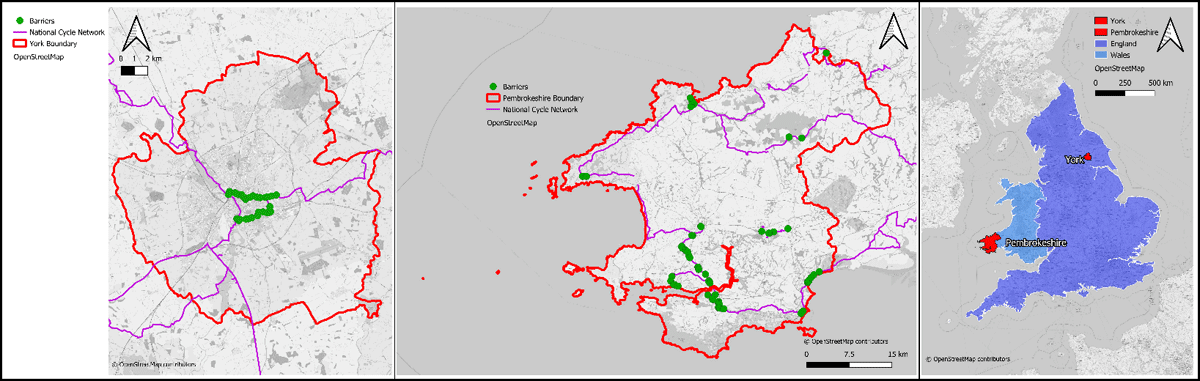
Figure 3: Location of audited barriers in York (Left), Pembrokeshire (Centre) and the location of York and Pembrokeshire in in England and Wales.
Central to this analysis is a dataset of barriers collected by Sustrans volunteers between 2015 and 2018 across the entire NCN. Each barrier contains data on the barrier’s critical width (the maximum width to pass through a given barrier), the restriction type, such as gate, bollard or pinch point, along with a spatial location and a photo of the restriction.
2.2 Methods
The methodology aims to consolidate the factors discussed within in the Background section of this paper into a simple overall score for each barrier on the cycle network. The proposed score is formed of five overall metrics with six further sub-metrics (Figure 4), which are weighted and normalised to provide an overall score.
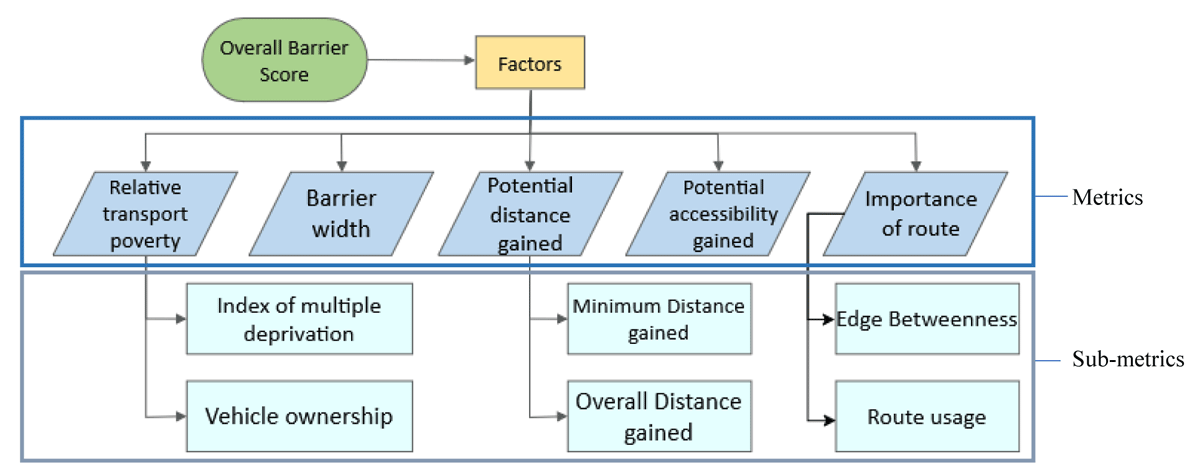
Figure 4: Overall hierarchy of metrics.
Processing and analysis use an open-source framework (QGIS.org, 2025; Van Rossum and Drake, 1995), with all code and processing methods available on a publicly available GitHub repository (Appendix 6.1). Workflows can be found in Appendix 6.3 – 6.5.
2.2.1 Critical barrier widths
Critical width relates to the minimum width of barriers, and therefore of the cycle that is able to pass through them. Barriers with higher critical widths are lower in removal priority as a higher proportion of users can pass through. Critical width is calculated as the narrowest section of the barrier, including the gap in chicanes. No threshold is set, i.e. all barriers are included no matter the critical negatable width, due to the number of potential factors that deter or prevent users passing through a barrier, such as confidence in negotiating a barrier alone (including the ability to do so), the variety of sizes of possible bikes that could be using a path, as well as issues around a general perception of deterrence that the presence of a barrier on path may have on potential users.
2.2.2 Route importance
The route importance metric indicates how much usage a segment of the cyclable network may have by cyclists. It is formed from two individual measures: route usage and edge betweenness centrality. In this context, an edge refers to segments of infrastructure represented in a network structure, with a network being formed of edges (streets) and nodes (junctions between streets). Both measures are based on the concept of betweenness centrality, a network metric that identifies the importance of an edge (a road segment) based on its role as a connection (Freeman, 1977). It is calculated as the number of shortest-cost paths between all pairs of nodes in the network that pass through a given edge.
In this application, edge betweenness centrality is used as an agnostic proxy for determining potential flow for users starting and finishing a journey at any location on the network, as applied by previous studies (Vybornova et al., 2022). It should be noted that features of the network, such as surface type or steepness, are not captured in this metric and thus the flow of users should only be considered an estimate.
Route usage is defined here as the betweenness of a given segment using the least-cost path between predefined start and end points sourced from an Origin-Destination (OD) matrix (McDaniel, Lowry and Dixon, 2014; Nordström and Manum, 2015). This indicates the current flow of users based on real-world data, specifically UK census travel-to-work data for cycling. These journeys are assigned to the population-weighted centroid of their respective census output zone. The flow of users on a segment where a barrier is located indicates how many people currently pass through it, which cannot predict how many more users may use the segment once the barrier is removed, but does provide a tangible number for its current level of importance to cycling trips. To supplement this and capture other potential journeys, edge betweenness centrality is used as it considers the least-cost path between every possible location on the network, regardless of existing travel patterns.
In order to model the flow of active travel users, the network of traversable routes is pre-processed following the work of Grond (2016) and Wasserman et al. (2019), with costs assigned to route segments based on the hierarchy of road type, as available in OpenStreetMap. The length of each segment is multiplied by a weighting factor, shown in Table 2, so larger busier roads are weighted highly while cycle paths are weighted very low, reflecting the general preference of active travel users for road selection (Wasserman et al., 2019; Alattar, Cottrill and Beecroft, 2021). These values are used as the weight costs in both the edge betweenness centrality calculation and the shortest-cost path calculation for the OD demand pairs.
Table 2: Route segment cost weighting multipliers.
| Path type | Weighting Multiplier |
| Cycleway | 1 |
| Bridleway | 1 |
| Path | 1 |
| Track | 1 |
| Living street | 2 |
| Trunk road | 4 |
| Service road | 4 |
| Primary road | 4 |
| Motorways | 4 |
2.2.3 Distance gained
Distance gained is the measure of how much more uninterrupted travel could be achieved along the NCN if a given barrier is removed from the network. It is formed of two parts: minimum distance gained, and overall distance gained. This is calculated via an OD matrix between all barriers along a network, with segment length as the impedance cost. Distances are then summed per origin and minimum/overall distance is obtained. Minimum distances are calculated on the basis that the removal of a barrier is far more effective if it opens up a significantly greater distance of uninterrupted travel through the network relative to the removal of other barriers.
2.2.4 Potential accessibility gain
To assess the accessibility improvement once a barrier is removed, a simple accessibility score both pre- and post-removal is determined. Accessibility is measured as the number of amenities available within a given catchment region or isochrone (Calafiore et al., 2022; Kesarovski and Hernández-Palacio, 2025 van Eldiijk et al., 2020). Amenities are sourced from OpenStreetMap using the “amenities” tag (Appendix 6.2), and the total accessible per Lower Layer Super Output Area (LSOA) zone through the network is calculated, using a distance limit of 1.2km for walking speed travel and 6km for cycling from the population weighted centroid. Walking speed is included in this metric to create a lower band of travel distance, which can be interpreted as those who may cycle at a slower pace (e.g. young children or those with young children, leisure users) or using slower wheeled mobility tools such as mobility scooters or electric wheelchairs, or indeed walking. This is performed first without the barriers acting as an impedance on movement, and secondly with barriers as impassable points (Figure 5) allowing a measure of the potential effect of removing a barrier to be calculated first in terms of amenity count differences, before also finding percentage change (Appendix 6.3).
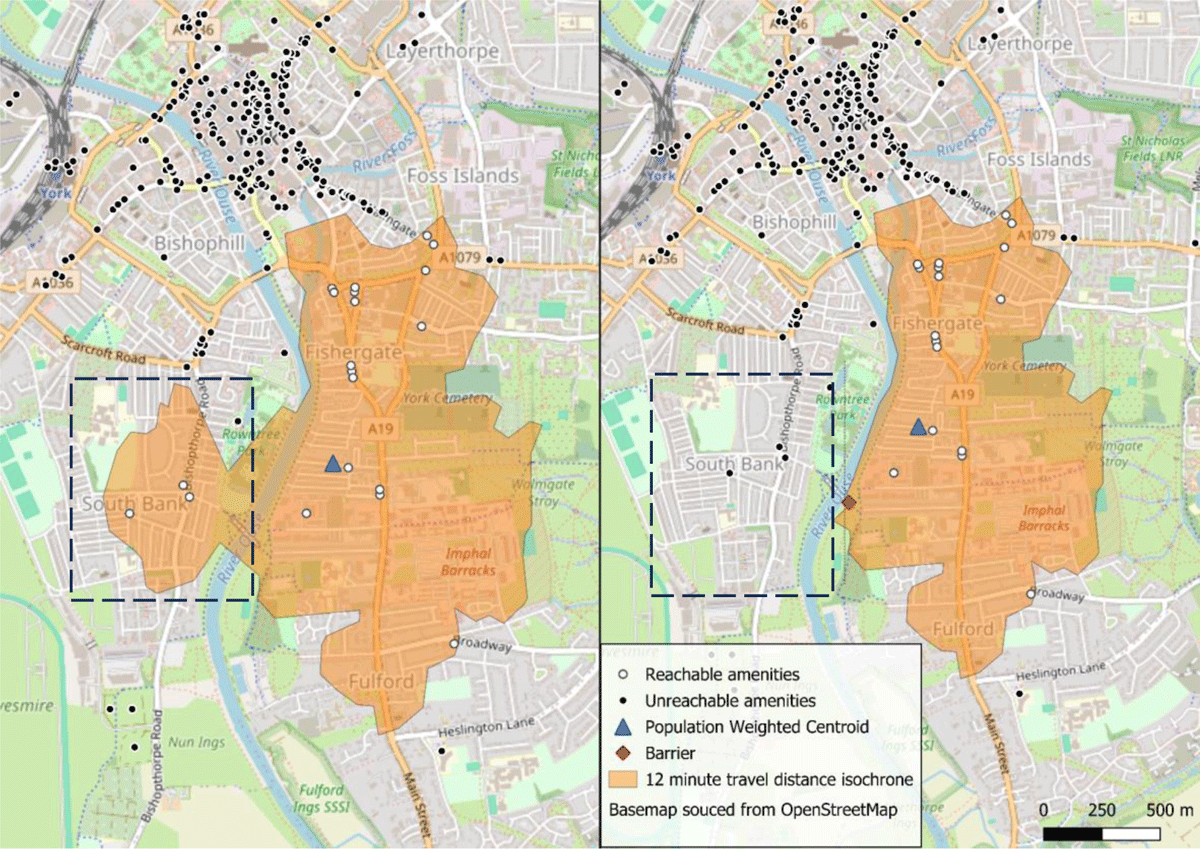
Figure 5: Change in area accessible within 12 minutes due to the presence of barriers. Note the area highlighted within the box where amenities are no longer reachable due to the barrier’s location on a bridge.
2.2.5 Relative transport poverty
As shown by Rind et al., (2015), Olsen et al., (2017), Curl, Clark and Kearns, (2018) and Norwood et al., (2014), areas of higher deprivation and transport poverty have a greater reliance on active travel as a mode of transport than those in areas of lower deprivation. It is therefore important to consider the location of the barrier in relation the spatial social-economic characteristics present. The Index of Multiple Deprivation (Office for National Statistics, 2015) provides a rank for every LSOA within England (the Welsh Index of Multiple Deprivation, Northern Ireland Multiple Deprivation Measure and Scottish Index of Multiple Deprivation provide similar measures for their respective study areas).
Although barriers are less prevalent in the areas of highest deprivation (Figure 6), it is these barriers that typically carry the greatest impact to the local community. Deprived areas are observed to be more reliant on active travel due to typically lower income levels and also have a greater proportion of people reporting to have some form of disability (Office for National Statistics, 2023; Sustrans, 2021a), and therefore are more likely to be impacted by barriers to accessing active travel facilities. The Index of Multiple Deprivation (IMD) score of the LSOA in which a barrier is located is therefore applied to the overall score per barrier. Similarly, areas with lower vehicle ownership benefit more from the removal of a barrier than areas with higher levels, and therefore car ownership levels, taken from the 2011 census are also added to the score (Department for Transport, 2025).
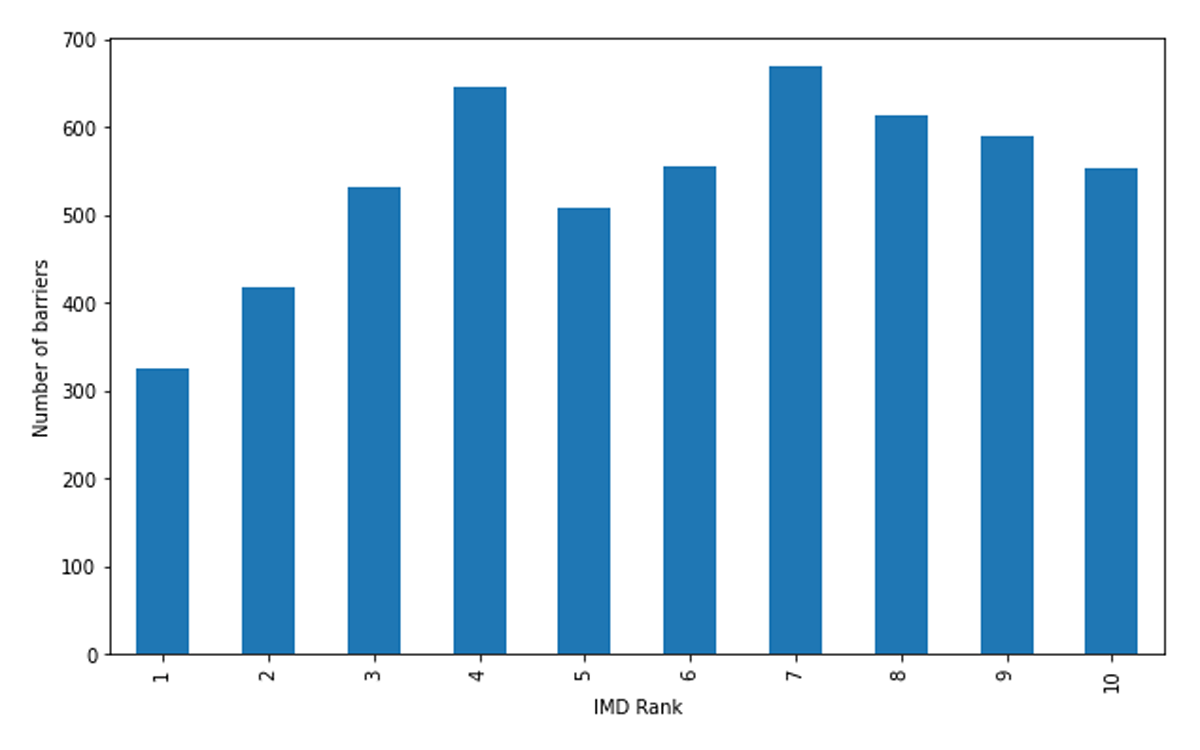
Figure 6: Distribution of NCN barrier counts across IMD decile ranks in England. A lower IMD score is indicative of higher deprivation, with a rank of 1 indicating the most deprived regions.
2.2.6 Index application
With all metrics computed and assigned to each barrier, the metrics are rescaled using a unity-based normalisation function prior to weighting (Equation 1) to bring all values with the range [0,1]. Rescaling ensures the relative metric score is considered, rather than absolute, to prevent distortions by the original units of measurements such as metres or counts when ranking metric importance.
Equation 1: Normalisation Function.
2.2.7 Metrics weighting
To weight the metrics, AHP was deployed to derive relative weightings from a group of domain experts from Sustrans, following the work of Saaty (1987), Ohta et al., (2007) and Panahi, Rezaie and Meshkani, (2013). AHP follows a four-step method, which when applied to the problem of barrier removal scoring, takes the following steps:
Define the goal of the process, with the goal in this instance being scoring of barriers.
Create a hierarchy of factors. The hierarchy will start with the goal at the top, followed by critical metrics and then sub-metrics forming the lower layer.
Construct pairwise comparison matrices for the critical metrics and sub-metrics.
Use the results of the pairwise comparison to assign weights.
The metrics used formed two hierarchical layers: the overall metrics and the sub-metrics (see Figure 4). All metrics in the critical metrics layer are ranked against each other via pairwise comparison. Sub-metrics are also ranked via a pairwise comparison, however only ever against other sub-metrics belonging to the same critical metric. The pairwise comparison was performed through consultation with domain experts from Sustrans. Priorities were obtained through a questionnaire, which utilised the following format:
-
If you were considering the removal of a barrier, what would you consider more important: factor x or factor y?
x
y -
How much more important is your choice relative to the alternative?
Equally important
Slightly more important
Strongly more important
Very strongly more important
Extremely more important
After collation of questionnaire feedback, linguistic responses were converted to numerical scores using Table 3.
Table 3: Response comparison scale.
| Linguistic Scale | Numerical Scale | Reciprocal Scale |
| A is as equally important as B (exactly equal) | 1 | 1 |
| A is slightly more important than B (slightly strong) | 3 | 1/3 |
| A is strongly more important than B (fairly strong) | 5 | 1/5 |
| A is very strongly more important than B (very strong) | 7 | 1/7 |
| A is extremely more important than B (extremely strong) | 9 | 1/9 |
The quality of judgements is assessed using a consistency ratio check. The consistency ratio determines how consistent weights are compared to allocating weights randomly. If stakeholders return an answer to any question that exceeds the maximum threshold for acceptable randomness (set at a consistency ratio of 0.1 (Saaty, 1987)), the responses cannot be used. Once consistency is confirmed, the normalised metric values are multiplied by the determined weights. Metrics are then summed per barrier to provide an overall score. This score indicates removal priority, with larger values signalling higher priority.
3. Results
3.1 Metrics
3.1.1 Critical widths
Critical widths of barriers vary from highly accessible at over 2.5mto well below acceptable at under 50cm. The distribution of barriers in the study areas and their widths is shown in Figure 7.
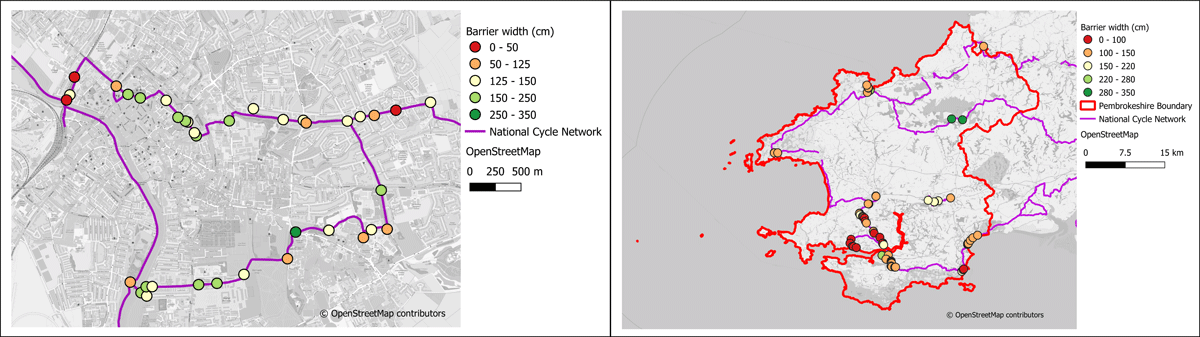
Figure 7: Barrier widths in York (left) and Pembrokeshire (right).
3.1.2 Relative Transport Poverty
Within York, deprivation is centred in six LSOAs ranked in the lowest two deciles, with IMD scores ranging from 2.062 to 34.209. Barrier locations display no strong correlation with transport poverty, as they are distributed across all deprivation levels and varied vehicle ownership regions. Pembrokeshire displays a similar trend; despite high deprivation in the south near Pembroke and Milford Haven (five LSOAs in the first decile), barriers are not specifically concentrated in these areas and thus the scores vary across the region. Furthermore, vehicle ownership peaks in towns such as St Davids and Tenby and declines in rural areas, which does not relate to barrier placement suggesting that no one socio-economic group is likely to have more barriers in a given area form these study regions (Appendix 6.8).
3.1.3 Potential distance gain
3.1.3.1 Minimum distance gain
Table 4 and Figure 8 display statistics regarding the potential minimum distance gained within both study areas. Pembrokeshire exhibits larger differences between the lowest and highest figures than York, but this is to be expected as York is significantly more built-up, thus the construction of barriers is more prevalent. York also contains fewer overall kilometres of NCN route, so any gain made is expected to be shorter.
Table 4: Potential distance gained statistics.
| Study area | Lowest gain | Highest gain | Range | Mean | Median |
| York – Minimum gain | 33.2m | 397.5m | 364.3m | 169.2m | 150.6m |
| Pembrokeshire – Minimum gain | 2.3m | 18862.3m | 18860m | 596.2m | 107.3m |
| York – Overall gain | 50.9m | 12899.6m | 12866.4m | 1957.1m | 807.2m |
| Pembrokeshire – Overall gain | 22.1m | 33591.4m | 33569.3 | 4937.6m | 1260.1m |
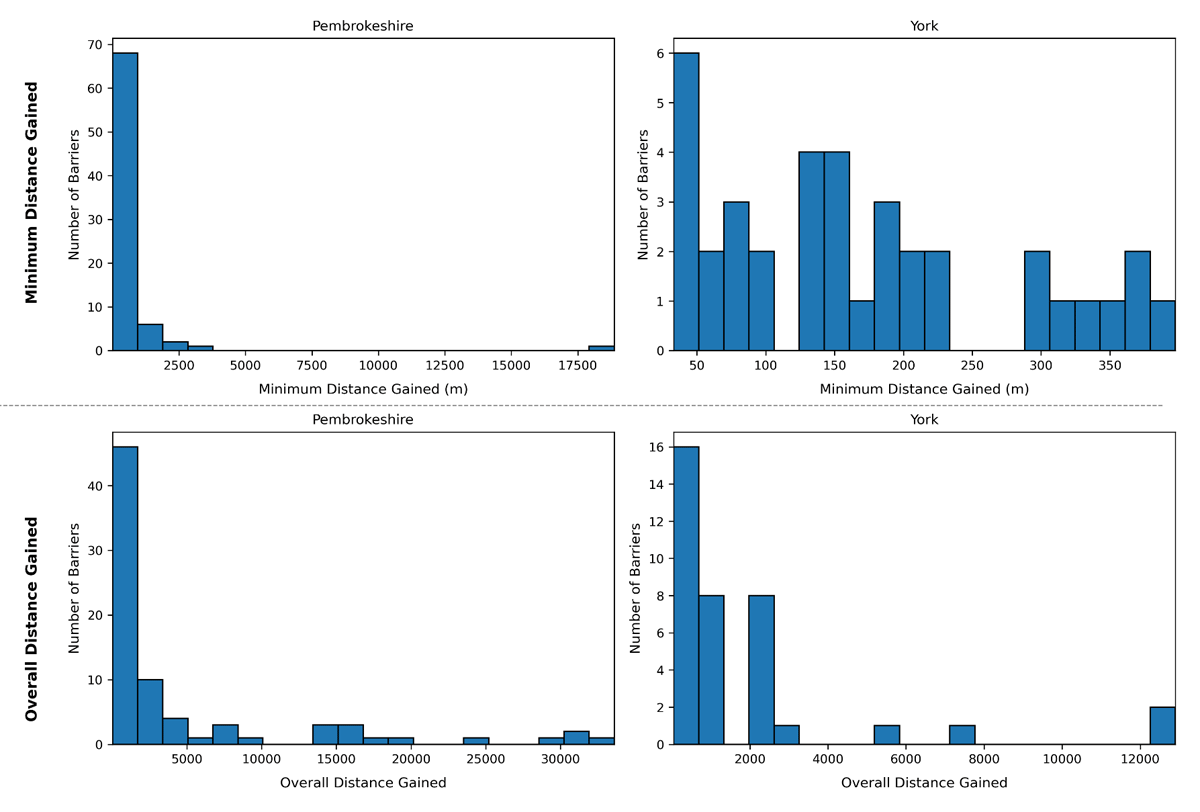
Figure 8: Distribution of distance gain values across each study area’s barriers.
3.1.3.2 Overall Distance gained
Similar to the minimum distance gained results, Pembrokeshire exhibits values with greater magnitude than York, likely due to the highly distributed nature and low counts of population, and number of NCN links across the area (Table 4). However, both areas exhibit potential distance gains beyond 10 kilometres, highlighting that the removal of a single barrier can provide very positive gains in pure distance (Figure 8).
3.1.4 Route importance
3.1.4.1 Route usage
Using the route usage metric, prominent routes can be observed linking key areas of the city. High usage is found along significant sections of the NCN, specifically around route to the West of the city centre and over the Millenium Bridge (Figure 9, Appendix 6.9). Similar trends are found within Pembrokeshire. Particularly through built-up areas, the route usage is highest on NCN routes, highlighting that barriers are present on the most important cycle routes. Across both areas, most barriers fall within the first bin of route usage, however high usage outliers are found at the upper end again showing that barriers are found on key routes for the areas (Figure 10).
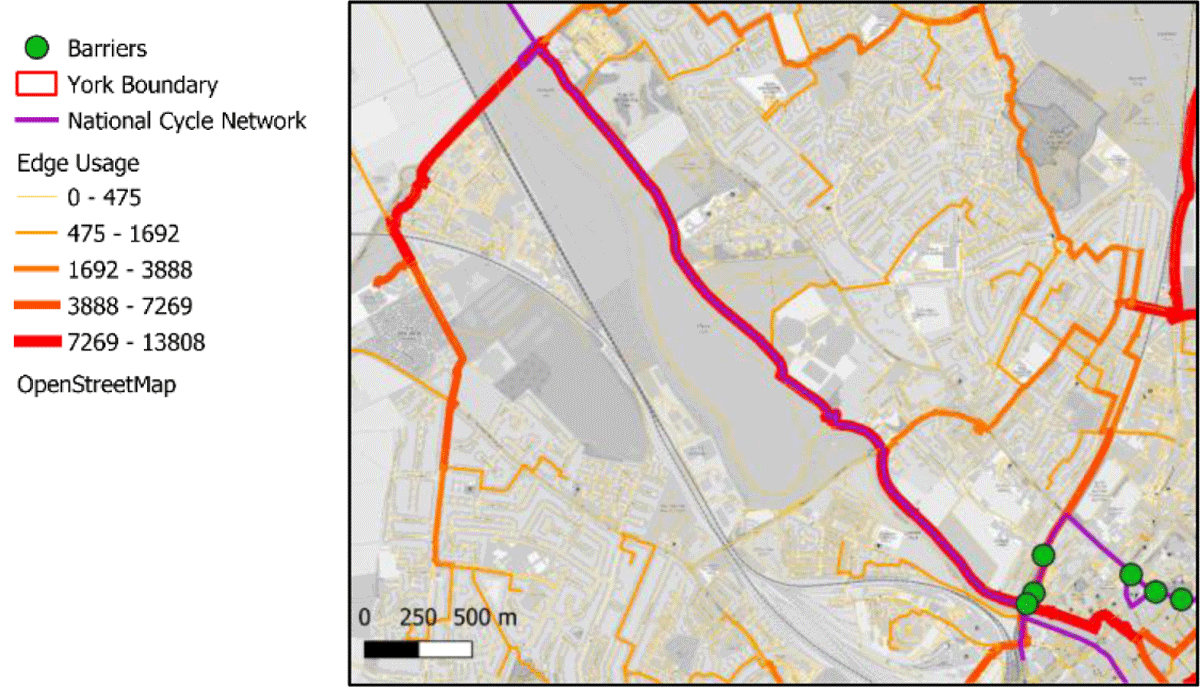
Figure 9: High route usage to the West of the city centre in York.
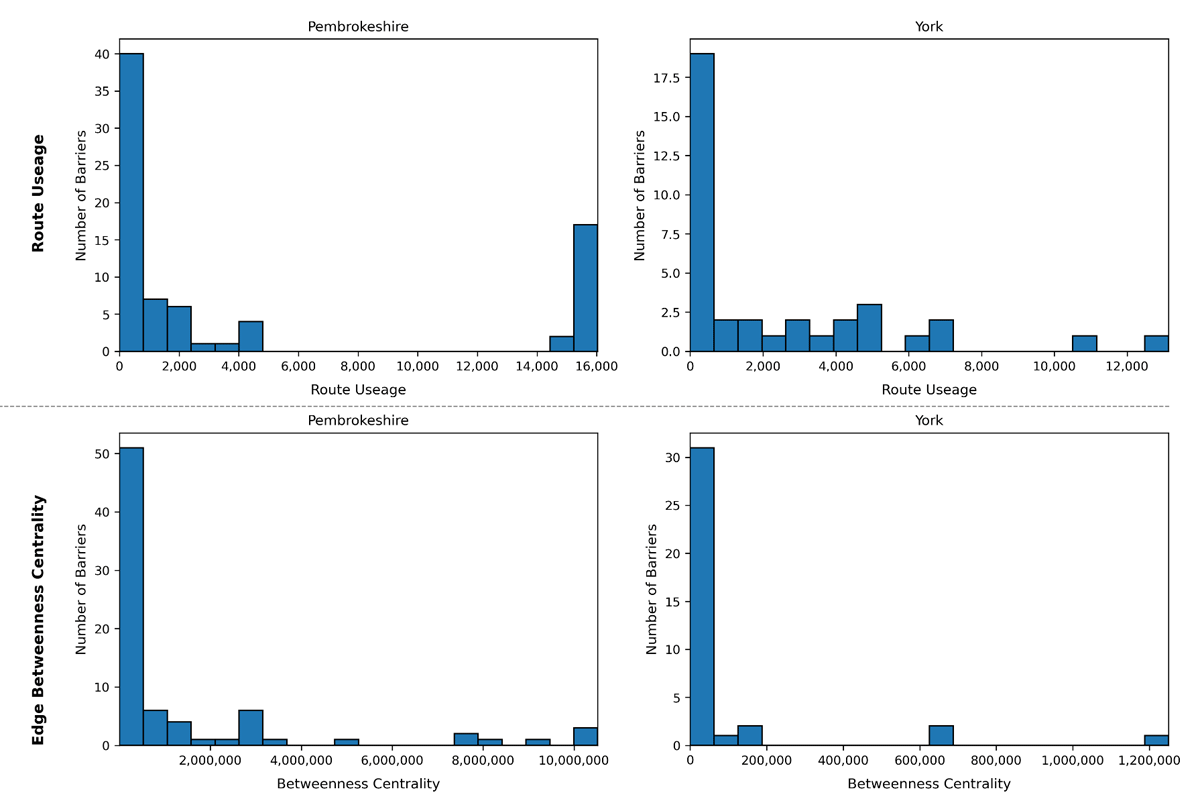
Figure 10: Route importance metrics across barriers in York and Pembrokeshire.
3.1.4.2 Edge betweenness centrality
Figure 11 shows the edge betweenness centrality values across York and Pembrokeshire. Betweenness values vary highly throughout both areas, though both follow arterial routes across the regions, much of which follows either the NCN or other developed cycle routes. York exhibits less coherent patterns, as the traversable network is denser within the city region than the rural paths and roads of Pembrokeshire. Similar to the route usage, both exhibit outlining barriers with very high potential usage, indicating barriers are present on key routes (Figure 10).
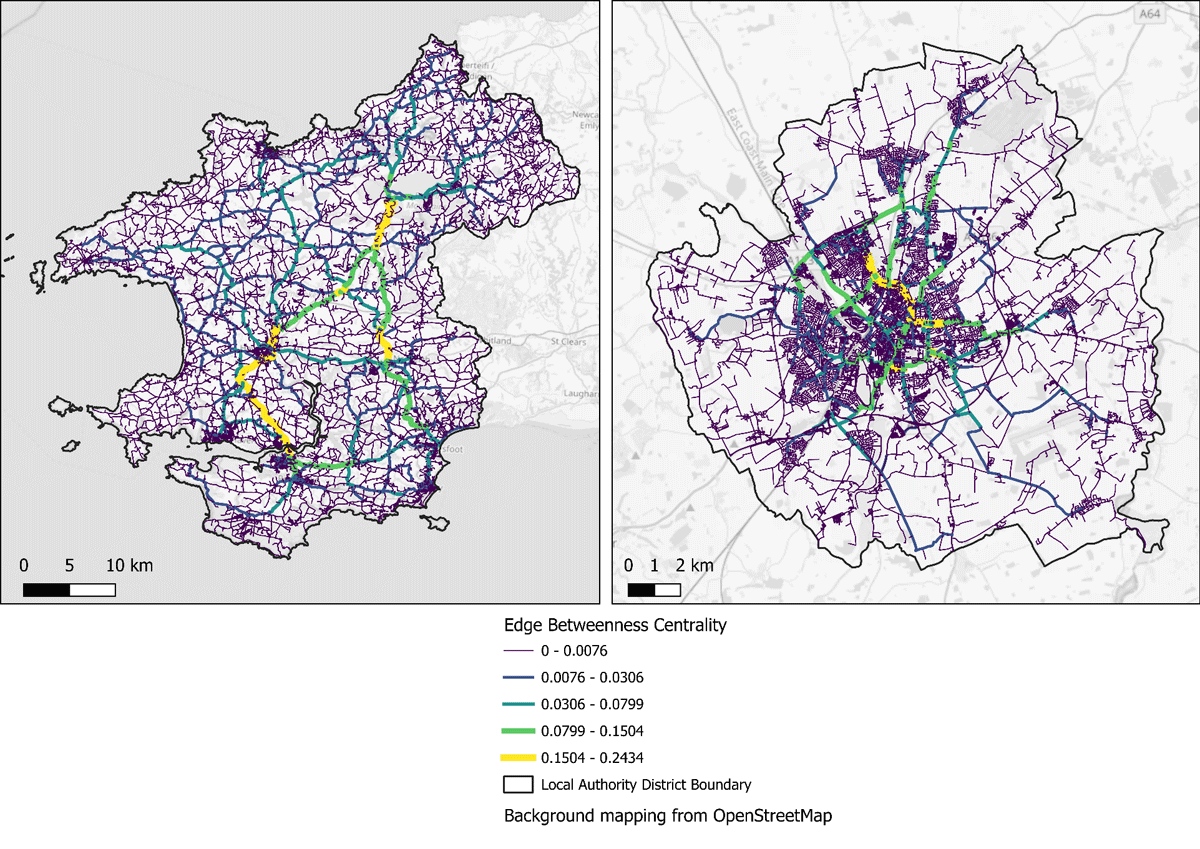
Figure 11: Edge betweenness centrality in Pembrokeshire (left) and York (right).
3.1.5 Potential Accessibility gain
The minimum, maximum and range of accessibility change per transport type are found in Table 5, highlighting the stark differences in the quantity of locations and services available when barriers are theoretically removed.
Table 5: Potential accessibility gain statistics per mode of travel.
| Study Area | Walking | Cycling | Mean | ||||||
| Minimum amenity difference | Maximum amenity difference | Mean amenity difference | Minimum amenity difference | Maximum amenity difference | Mean amenity difference | Minimum amenity difference | Maximum amenity difference | Mean amenity difference | |
| York | 34 | 125 | 74 | 157 | 731 | 368 | 40 | 137 | 84 |
| Pembrokeshire | 0 | 11 | 1 | 0 | 3 | 26 | 0 | 11 | 1 |
For York, barriers within the trip range of the city centre are the most affected. Both barriers located within the city centre and those located further than an average trip away see a comparatively low drop in amenity accessibility (Figure 12). Pembrokeshire displays different spatial patterns. Low amenity accessibility is found at barriers across most of the region. Accessibility as a percentage of improvement overall improvement is shown in Table 6. Again, York sees greater gains in accessibility to amenities by the cycle network for each barrier removed than Pembrokeshire.
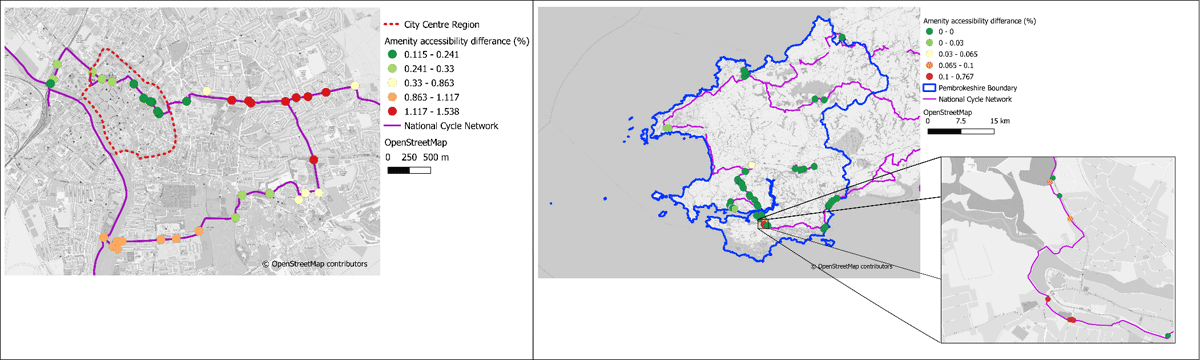
Figure 12: Amenity accessibility difference per barrier across York (left) and Pembrokeshire (right).
Table 6: Percentage potential accessibility change.
| Study Area | Minimum amenity change (%) | Maximum amenity change (%) | Mean amenity change (%) |
| York | 0.11 | 1.53 | 0.66 |
| Pembrokeshire | 0 | 0.78 | 0.04 |
3.2 Weightings
From each AHP questionnaire, the consistency ratio is checked to ensure valid answers. This is a measure of how consistent decision-makers pairwise comparisons are, where a ratio less than or equal to 0.1 is an acceptable level of consistency (Saaty, 1987). Of the completed questionaries, two responses gave consistency ratios greater than 0.1. These questionnaires were removed from the overall results accordingly. From the remaining responses, the linguistic scores were translated to numerical ratios (Table 3) and weightings created (Table 7).
Table 7: AHP derived metric weights. Barrier width is found to be the most important factor, although with the highest level of variation of importance from the respondents.
| Criterion | Weights | +/– |
| Barrier width | 41.2% | 16.0% |
| Potential accessibility gained | 35.9% | 9.3% |
| Relative transport poverty | 9.3% | 1.9% |
| Potential distance gained | 7.2% | 1.0% |
| Importance of route | 6.4% | 1.0% |
The consistency ratio, 0.026, is below the threshold value so therefore the determined weights can be accepted, while the overall consensus value is 90.4%. The barrier critical width has been determined to have the highest priority in overall scores, with the importance of the route on which the barrier is located determined to be of lowest importance. The largest variance of opinion is with barrier critical width, whilst potential distance gained and importance of the route saw the lowest variance of opinion.
Shown in Table 8 are the derived weights from the AHP process. Sub-metric weights are calculated as a percentage of their respective metric’s weighting, and can be found in detail in Appendix 6.7.
Table 8: Overall metric weights.
| Metric | Metric weight | Sub-metric | Sub-metric weight |
| Importance of route | 6.4% | Edge betweenness centrality | 5.3% |
| Edge usage | 1.1% | ||
| Potential accessibility gained | 35.9% | N/A | N/A |
| Relative transport poverty | 9.3% | Vehicle ownership | 1.7% |
| Index of multiple deprivation | 7.6% | ||
| Distance gained | 7.2% | Minimum distance gain | 1.5% |
| Overall distance gain | 5.7% | ||
| Barrier width | 41.2% | N/A | N/A |
3.3 Final barrier scores
The weightings are used to score the barriers within the two case study areas (Figure 13). For York, high scoring barriers are found in clusters along sections of cycle network that provide access from the periphery of the city into the centre. In Pembrokeshire, the high priority barriers are found within the urban areas in the region, where there is both a higher density of barriers and a higher impact from individual barriers.
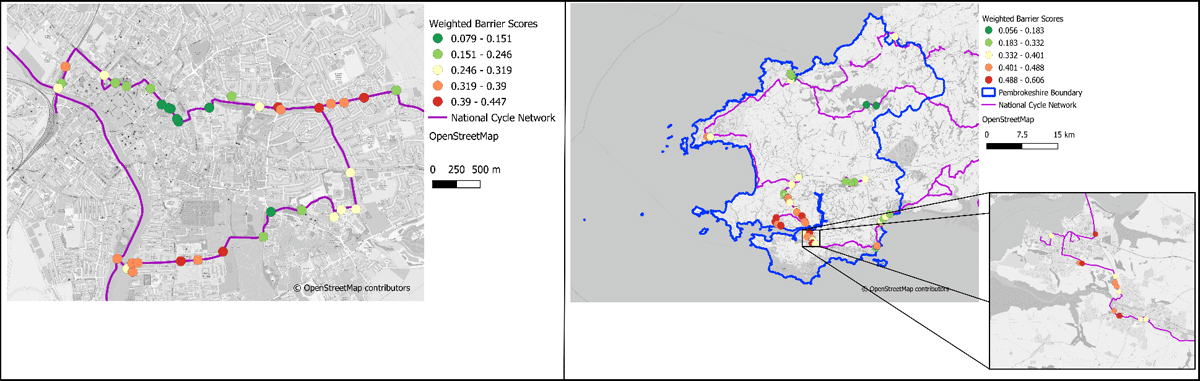
Figure 13: Weighted scores across York (left) and Pembrokeshire (right).
Through visual analysis of the scores, clear spatial patterns emerge. Clusters appear in the north-east and south-west of York, and in Pembrokeshire in south-west. Such clusters may indicate a high density of barriers that present a significant obstruction to access and use of the network. These spatial clusters can be confirmed or rejected through use of the Local Moran’s I statistic of spatial association (Anselin, 1995) for both areas. Local Moran’s I is a test for local spatial autocorrelation, to measure how similar of different values are from neighbouring locations. Clusters are found where (95% confidence interval), with the -value indicating whether the observed pattern around the location is unlikely to have occurred at random.
Significant clusters of high values (High-High Clusters), are most prevalent in Pembrokeshire, where distinct areas of high removal priority take up 11.7% of all barriers (Figure 14). These are predominately found near urban regions, where the highest proportion of potential users are found. Comparatively, low-low clusters, low values with low significance, are generally found in rural regions. Four outliers are found in total, with three low-high outliers found in and around the town of Pembroke. The single high-low outlier is found the coastal town of Tenby in the south-east.
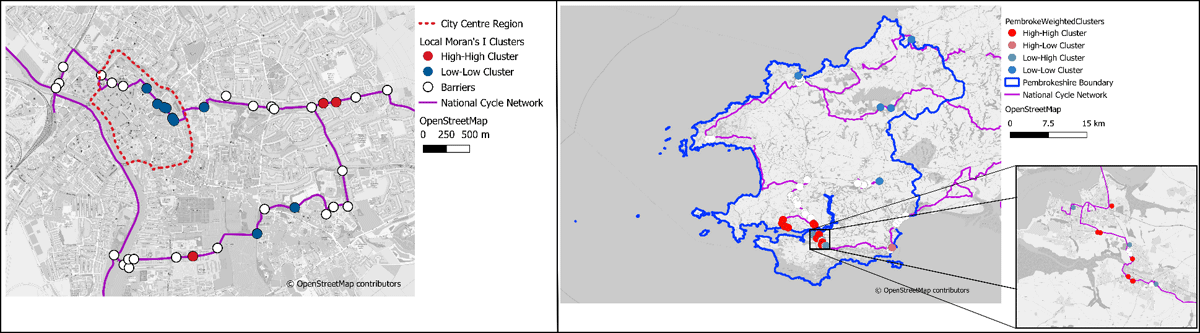
Figure 14: Spatial clustering of barrier scores in York (left) and Pembrokeshire (right).
York has no significant outliers but does show signs of clustering. A section of seven low-low clusters is found near the city centre, representing 21.6% of all barriers within this area. Three barriers within high-high clusters are found, two within the north-east and one to the south-west of the region.
4. Discussion
4.1 Overall findings
The methodology has produced an overall score to assess the removal priority of barriers across the NCN to help improve access to disabled people or those using non-standard cycles. Both study sites used to test the methodology display separate spatial characteristics but the overall pattern of high priority barriers remains similar. Barriers that block movement in and out of zones such as town or city centres are predominately the highest ranked as might be expected, with these giving a greater benefit potential to users. This is shown as linking areas of the city within York or linking towns together within Pembrokeshire (Figure 15), and therefore opening up access for non-standard cycle users to a greater number of services, economic opportunities and a greater length of protected cycling infrastructure with associated health benefits. The potential reduction in community severance will provide better opportunities in terms of accessibility to those who live around these highest ranked barriers.
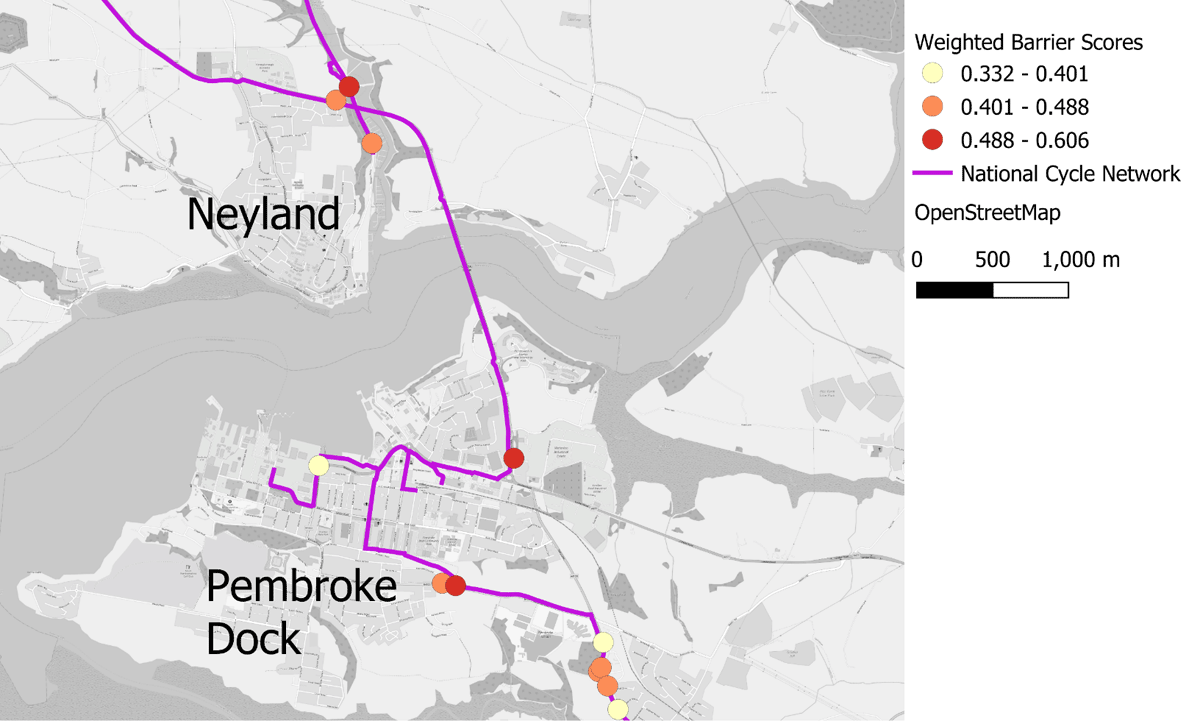
Figure 15: High barrier scores on critical links crossing a bridge connecting two urban areas.
Combining into an overall score provides an easily implementable tool for decision makers to use, regardless of their geospatial knowledge. There is sufficient variability between scores to differentiate between barriers but scores are not so widely spread that groups of barriers cannot be visually identified (Figures 13 and 14). The clustering of highly-scored barriers provides a practical solution for decision makers in being able to more easily identify clusters that can be targeted for removal, which is often more economically effective than focusing on isolated elements. The clusters indicate optimal areas for barrier removal as one overall removal project due to their proximity. This approach would offer economic savings and achieve maximum societal improvement for disabled cyclists and other potential beneficiaries.
4.2 Amenity accessibility
Many barriers within Pembrokeshire had zero change in accessibility scores (Table 6). This could be due to the remoteness of much of the area, as many barriers are simply not in a realistic cycling range of any amenities. All barriers within York show a change in amenity accessibility, suggesting all barriers within York are currently discriminatory to anyone who cannot pass through them. This highlights the importance of barrier removal schemes, with these barriers causing reduced accessibility to basic amenities.
As highlighted by the difference in the count of amenities accessible within the walk/cycle range of a barrier between York and Pembrokeshire, access to amenities varies dependent on location (Table 6). This is to be expected as rural areas have lower provisions of amenities and services compared with built-up areas (Vitale Brovarone and Cotella, 2020). However, it has been well documented that not all areas of OpenStreetMap are displayed to the same depth or detail (Haklay, 2010). Thus, it is to be expected that York contains better documentation of amenities than Pembrokeshire because of its urban density but also because that urban density leads to more potential OpenStreetMap users. Thus, while the results obtained in section 4.1.5 were expected, these results should not be taken as perfect findings.
4.3 Scoring metric
The results from the AHP have led to significant differences in the weighting of factors. The critical width and potential accessibility gained metrics account for the majority of the overall score with a combined weighting of 77.1%, resulting in scores being most influenced by their critical width and accessibility scores. However, critical width saw the greatest variation in opinions from the respondents to the AHP, varying from a weighting of 50.2% to as low as 28.3%. This is intuitive as barriers are physical factors that affect the usability of the cycle path for disabled people or those in larger than standard bicycles. A very wide critical width may not affect the majority users, thus if removal is to occur, the gains will be minimal compared with a largely impassable barrier. Feedback from the consulted stakeholders indicated that accessibility change was deemed to best measure latent demand and therefore was equally rated as a high factor.
The lowest weighted factor is the route usage (1.1%), due to the belief from topic experts that as this only factored existing usage, being based on travel to work data from the UK census, it did not capture usage for other activities or latent demand and so should not have a significant influence on barrier scoring. While no metrics are fully able to measure potential latent demand from the removal of a barrier, the route usage is deemed to be less capable of measuring this than edge betweenness centrality with a 100% consensus on the weighting of this metric from all questionnaires received. Vehicle ownership in an area was also deemed to have very low importance (1.7%), and similarly the minimum distance gained metric also received a low weighting (1.5%). Given the low influence of these metrics, it is feasible that similar outputs could be achieved without them, though this would reduce the holistic nature of the score. Further sensitivity analysis could be undertaken to explore the effect of such metrics and if the processing time associated with these is worthwhile.
Weightings are inherently a reflection of what a given person perceives the value of active travel networks to be, and who/what the network is for. The weightings found with this study indicate a consensus that the primary use for the network is to reach amenities, as indicated by the high critical width and accessibility weightings already discussed. However, other stakeholder groups may have different perceptions and thus weightings may differ, with those interested in active travel for leisure likely to value distance gained more strongly, for instance, as a measure of the ability to undertake longer trips. The questions asked of the stakeholders could also be adapted for use with other stakeholder groups, as the questions used in the MCDM process of this study do not cover aspects that could be considered, such as leisure, health or tourism. Alternatively, local authorities or administrators may value the route importance more highly as they aim to improve commuting by active travel. The methodology presented here allows for the alteration of weights at the end of the processing pipeline, and therefore can accommodate different scenarios.
Whilst the approaches presented aim to use quantifiable and measurable metrics, ultimately the true hinderance of a barrier can only be known through more qualitative measures. Extensive consultation with the people who currently use the active travel network and the people who may use the active travel network if changes were implemented would bring viewpoints and opinions that an index may not be able to convert to a number. It is these viewpoints, however, that would paint the true picture of which barriers needed to be removed first, and this tool enables a broader assessment prior to more local focused work to identify those barriers whose removal would bring the greatest benefit.
4.4 Wider context of barrier removal
Although wider progress is being made to remove barriers on active travel corridors, the perceived risks of removing them, such as increase in crime, still remain. This friction will persist until a larger evidence base is created for pre- and post-removal studies. Data driven tools, such as the one developed in this paper, begin to provide decision makers an evidence base for removing barriers. Taking objective measurements regarding the characteristics of each barrier within the local authority district allows—for the first time—to document multiple measured benefits of removing each barrier. This is in contrast to previous schemes, which have tended to focus on community reporting, perceptions of importance and local knowledge of the active travel network. Our data driven approach can be used to complement these, not replace them, as these less quantifiable factors are nonetheless important.
5. Conclusion
Disabled cyclists, and those using non-standard cycles, often encounter difficulties accessing and using the UK’s NCN due to the presence of physical barriers across the network, creating an unequitable provision of safe cycling routes. This project has developed a methodology and analysis tool to determine the removal priority of barriers across the NCN to further encourage the opening up of routes in a more focused manner, where the greatest benefits to potential users can be seen more quickly. The process can be implemented on any section of the NCN utilising open data and a dataset of barriers. Decision-makers can use the tool to support decisions around barrier removal, which may achieve maximum benefit to potential users and in turn make active travel networks accessible for all.
Surprisingly, little literature focuses on the effects of barriers in the context of active travel for all. The metrics devised provide an attempt at holistically scoring barriers by considering not just the physical impedance of the barrier, but the context surrounding it. Whilst all the metrics were deemed to have a level of importance, the weightings and feedback from topic area experts highlighted that the relative importance of metrics did vary, and therefore these were derived through use of an AHP with industry experts and stakeholders in barrier removal projects. Critical width was deemed the most important factor, at 41.2% of the overall weighting, though other factors also remain important. Decision makers can use this final barrier score as a part of the justification for a barrier removal scheme, and further use some of the contributing metrics to explore the potential gains as part of a scheme development process.
Whilst the methodology provided gives logical results within the study areas, this approach is not without areas that would benefit from additional work. There is a lack of available empirical data from which to undertake validation of scores and while the statistical validation used in the results section allows for local trends to be confirmed, actual confirmation of whether the correct barriers have been identified is limited. Combining this work’s approach with pre- and post-monitoring on and around sites where barrier removal has occurred would provide insights into the effectiveness of the proposed methodology.
The NCN used in this study represents a key backbone of active travel infrastructure in the UK, but it by no means encompasses all possible routes; other routes may be managed by other organisations, local authorities and similar. Meanwhile, the barrier dataset used only considers barriers on the NCN that sit on the network or that provide access to the network, and therefore those on any feeder routes may be excluded. It is also known that surface type, slope angle and segregation from roads all affect user choice (Grond, 2016; Carroll, Caulfield and Ahern, 2019), and this may be exacerbated with those using larger-than-standard cycles, or with disabled cyclists more generally.
The barriers, or impediments to accessing cycle networks are a national challenge in the UK for creating equitable cycling infrastructure. The work developed in this project could not just help to address this but could also form part of a larger toolset to identify weaknesses in the current active travel infrastructure, and therefore also opportunities to make it more accessible and equitable, allowing more people to use and take advantage of these routes for leisure or to access opportunities. The metrics developed in this study also highlight novel ways in which routes can be assessed, and therefore used in other studies focused on improving equitable access to cycle networks.
Additional File
The additional file for this article can be found as follows:
Appendix DOI: https://doi.org/10.16997/ats.1994.s1
Acknowledgements
This work is indebted to a collaboration with Sustrans, who made this research possible. We, the authors, give particular thanks to Ralph Hughes at Sustrans for his contributions to this project.
Competing Interests
The authors have no competing interests to declare.
References
Alattar, M.A., Cottrill, C. and Beecroft, M. (2021) ‘Modelling cyclists’ route choice using Strava and OSMnx: A case study of the City of Glasgow’, Transportation Research Interdisciplinary Perspectives, 9, 100301. Available at: http://doi.org/10.1016/J.TRIP.2021.100301
Anciaes, P.R., (2013) ‘Measuring community severance for transport policy and project appraisal’, WIT Transactions on The Built Environment, 130, pp. 559–570. Available at: http://doi.org/10.2495/UT130451
Anciaes, P.R., Jones, P. and Mindell, J.S. (2016) ‘Community Severance: Where Is It Found and at What Cost?’, Transport Reviews, 36(3), pp. 293–317. Available at: http://doi.org/10.1080/01441647.2015.1077286
Andrews, N. and Clement, I. (2021) ‘Invisible cyclists? Acknowledging the needs and rights of disabled cyclists’, in D. Zuev, K. Psarikidou and C. Popan (eds.) Cycling Societies: Innovations, Inequalities and Governance. 1st edn. London: Routledge, p. 7. Available at: http://doi.org/10.4324/9780429321092
Anselin, L. (1995). Local Indicators of Spatial Association—LISA. Geographical Analysis, 27(2), 93–115. Available at: http://doi.org/10.1111/J.1538-4632.1995.TB00338.X
BikeBiz (2016) Anti motorbike barriers to be removed from national cycle network. Available at: https://bikebiz.com/anti-motorbike-barriers-to-be-removed-from-national-cycle-network/ (Accessed: 08/06/2022).
Both, A., Gunn, L., Higgs, C., Davern, M., Jafari, A., Boulange, C. and Giles-Corti, B. (2022). Achieving ‘Active’ 30 Minute Cities: How Feasible Is It to Reach Work within 30 Minutes Using Active Transport Modes? ISPRS International Journal of Geo-Information 2022, Vol. 11, 11(1). Available at: http://doi.org/10.3390/IJGI11010058
Brice, X. (2020) ‘The United Kingdom’s National Cycle Network: Paths for Everyone, Past, Present and Future’ in P. Pileri and R. Moscarelli (eds.) Cycling & Walking for Regional Development. 1st edn. Springer Cham. Available at: http://doi.org/10.1007/978-3-030-44003-9
Burns, T., Oram, M.M. and Claris, S. (2019). Cycling for Everyone. 28 July. Available at: https://www.sustrans.org.uk/media/7377/cycling_for_everyone-sustrans-arup.pdf (Accessed 7 January 2022).
Calafiore, A., Dunning, R., Nurse, A. and Singleton, A. (2022) ‘The 20-minute city: An equity analysis of Liverpool City Region’, Transportation Research Part D: Transport and Environment, 102, p.103111. Available at: http://doi.org/10.1016/j.trd.2021.103111
Carroll, P., Caulfield, B. and Ahern, A. (2019) ‘Modelling the potential benefits of increased active travel’, Transport Policy, 79, pp.82–92. Available at: http://doi.org/10.1016/j.tranpol.2019.04.020
Clark, J.M. (1991) The appraisal of community severance. Department for Transport, 135, ISSN: 0266-7045, (135).
Clayton, W. and Parkin, J. (2016) Cycling and disability: a review. Universities’ Transport Study Group 48th Annual Conference. Available at: https://uwe-repository.worktribe.com/output/915468/cycling-and-disability-a-review (Accessed 22 February 2026).
Cox, B. and Bartle, C. (2020). A qualitative study of the accessibility of a typical UK town cycle network to disabled cyclists. Journal of Transport and Health, 19. Available at: http://doi.org/10.1016/j.jth.2020.100954
Curl, A., Clark, J. and Kearns, A. (2018) ‘Household car adoption and financial distress in deprived urban communities: A case of forced car ownership?’, Transport Policy, 65, pp.61–71. Available at: http://doi.org/10.1016/j.tranpol.2017.01.002
Cycling UK (2025) Best practice in engaging disabled people in cycling for active travel. Available at: www.cyclinguk.org/sites/default/files/downloads/2025-09/ice-report-update.pdf (Accessed 3 March 2025).
Department for Transport (2020) Cycle infrastructure design (LTN 1/20). Available at: https://www.gov.uk/government/publications/cycle-infrastructure-design-ltn-120 (Accessed 3 July 2025).
Department for Transport (2025) NTS 2024: Household car availability and trends in car trips. Available at: https://www.gov.uk/government/statistics/national-travel-survey-2024/nts-2024-household-car-availability-and-trends-in-car-trips (Accessed 2 January 2026).
Freeman, L. (1977). ‘A set of measures of centrality based on betweenness’, Sociometry. 40(1): pp. 35–41. Available at: http://doi.org/10.2307/3033543
Grond, K. (2016) Route choice modelling of cyclists in Toronto (Doctoral dissertation, University of Toronto). Available at: https://utoronto.scholaris.ca/server/api/core/bitstreams/ce9cb312-cc45-4e4e-b4ee-100104865b59/content (Accessed 23 February 2026).
Haklay, M. (2010) ‘How good is volunteered geographical information? A comparative study of OpenStreetMap and Ordnance Survey datasets’, Environment and planning B: Planning and design, 37(4), pp.682–703. Available at: http://doi.org/10.1068/b35097
Inckle, K. (2020) ‘Disability, cycling and health: Impacts and (missed) opportunities in public health’, Scandinavian Journal of Disability Research, 22(1), pp. 417–427. Available at: http://doi.org/10.16993/sjdr.695
Inckle, K (2022) ‘The benefits (and barriers) to disabled people cycling’, in G. Norcliffe, U. Brogan, P. Cox, B. Gao, T. Hadland, S. Hanlon, T. Jones, N. Oddy and L. Vivanco (eds.) Routledge Companion to Cycling. 1st edn. London: Routledge. Available at: http://doi.org/10.4324/9781003142041
Jarlebring, I., Persson, S., Lindqvist, E. and Eliasson, J. (2002) Beräkning av gångtrafikeffekter vid väginvesteringar – En handledning. Transek. Internal document, Trafikverket.
Kesarovski, T. and Hernández-Palacio, F. (2025). Quantity Versus Quality: Do Citizens in Denser Neighbourhoods Have Poorer Access to Urban Open Spaces? A Pilot Study in Stavanger, Norway. Urban Book Series, Part F (229), 95–110. Available at: http://doi.org/10.1007/978-3-031-77752-3_6
Larrington-Spencer, H. (2025) ‘Autoethnography of disability and active travel in Greater Manchester: Encountering (non)citizenship through access controls on traffic-free walking, wheeling and cycling paths’, Urban Studies. Available at: http://doi.org/10.1177/00420980241311728
Lowry, M. and Loh, T.H. (2017) ‘Quantifying bicycle network connectivity’, Preventive medicine, 95, pp. S134–S140. Available at: http://doi.org/10.1016/j.ypmed.2016.12.007
McDaniel, S., Lowry, M.B. and Dixon, M. (2014) ‘Using origin–destination centrality to estimate directional bicycle volumes’, Transportation Research Record, 2430(1), pp. 12–19. Available at: http://doi.org/10.3141/2430-02
Nordström, T. and Manum, B. (2015) ‘Measuring bikeability: Space syntax based methods applied in planning for improved conditions for bicycling in Oslo’, In SSS 2015-10th International Space Syntax Symposium (pp. 1–14).
Norwood, P., Eberth, B., Farrar, S., Anable, J. and Ludbrook, A. (2014) ‘Active travel intervention and physical activity behaviour: An evaluation’, Social science & medicine, 113, pp.50–58. Available at: http://doi.org/10.1016/j.socscimed.2014.05.003
Office for National Statistics, UK Government. (2015) English indices of deprivation 2015. Available at: www.gov.uk/government/statistics/english-indices-of-deprivation-2015 (Accessed 24 July 2022).
Office for National Statistics, UK Government. (2023) Disablility by age, sex and deprivation, England and Wales: Census 2021. Available at: https://www.ons.gov.uk/peoplepopulationandcommunity/healthandsocialcare/disability/articles/disabilitybyagesexanddeprivationenglandandwales/census2021 (Accessed 24 November 2025).
Ohta, K., Kobashi, G., Takano, S., Kagaya, S., Yamada, H., Minakami, H. and Yamamura, E. (2007) ‘Analysis of the geographical accessibility of neurosurgical emergency hospitals in Sapporo city using GIS and AHP’, International Journal of Geographical Information Science, 21(6), pp. 687–698. Available at: http://doi.org/10.1080/13658810601135692
Olsen, J.R., Mitchell, R., Mutrie, N., Foley, L. and Ogilvie, D. (2017) ‘Population levels of, and inequalities in, active travel: a national, cross-sectional study of adults in Scotland’, Preventive Medicine Reports, 8, pp. 129–134. Available at: http://doi.org/10.1016/j.pmedr.2017.09.008
Panahi, M., Rezaie, F. and Meshkani, S. (2013) ‘Seismic vulnerability assessment of school buildings in Tehran city based on AHP and GIS’, Nat. Hazards Earth Syst. Sci. Discuss, 1, pp. 4511–4538. Available at: http://doi.org/10.5194/nhess-14-969-2014
QGIS.org (2025). QGIS Geographic Information System. QGIS Association. Available at: https://www.qgis.org (Accessed 23 February 2026).
Rind, E., Shortt, N., Mitchell, R., Richardson, E.A. and Pearce, J. (2015) ‘Are income-related differences in active travel associated with physical environmental characteristics? A multi-level ecological approach’, International Journal of Behavioural Nutrition and Physical Activity, 12(73). Available at: http://doi.org/10.1186/s12966-015-0217-1
Reyier, J. (1987) 15E Calculation guide – Investments in roads and streets (No. 1986:1E). Swedish National Road Administration, Borlänge. Internal document Trafikverket.
Saaty, R.W. (1987) ‘The analytic hierarchy process—what it is and how it is used’, Mathematical modelling, 9(3–5), pp.161–176. Available at: http://doi.org/10.1016/0270-0255(87)90473-8
Sałabun, W., Wątróbski, J. and Shekhovtsov, A. (2020) ‘Are MCDA methods benchmarkable? a comparative study of topsis, vikor, copras, and promethee ii methods’, Symmetry, 12(9), p. 1549. Available at: http://doi.org/10.3390/sym12091549
Stojčić, M., Zavadskas, E.K., Pamučar, D., Stević, Ž. and Mardani, A. (2019) ‘Application of MCDM methods in sustainability engineering: A literature review 2008–2018’, Symmetry, 11(3), p. 350. Available at: http://doi.org/10.3390/sym11030350
Sustrans (2018) Paths for Everyone. Available at: https://www.sustrans.org.uk/about-us/paths-for-everyone/ (Accessed: 22 May 2022).
Sustrans (2020) Why removing restrictive barriers must be part of our response to Covid-19. Available at: https://www.sustrans.org.uk/our-blog/opinion/2020/june/why-removing-restrictive-barriers-must-be-part-of-our-response-to-covid-19/ (Accessed: 1 July 2022).
Sustrans (2021a) How we remove barriers from the national cycle network. Available at: https://www.sustrans.org.uk/our-blog/opinion/2021/november/how-we-remove-barriers-from-the-national-cycle-network/ (Accessed: 1 July 2022).
Sustrans (2021b) The walking and cycling index Available at: https://www.walkwheelcycletrust.org.uk/media/10527/sustrans-2021-walking-and-cycling-index-aggregated-report.pdf (Accessed: 20 December 2025).
Sustrans (2023) The National Cycle Network. Available at: https://www.sustrans.org.uk/national-cycle-network/ (Accessed: 1 June 2022).
Sustrans (2024) Long-term impacts of barrier redesign – a case study in York. Available at: https://www.sustrans.org.uk/media/13616/long-term-impacts-of-barrier-redesign-a-case-study-in-york-v2.pdf (Accessed: 20 November 2024).
Transport for London (2012) Attitudes towards cycling Annual report 2012. Available at: https://content.tfl.gov.uk/attitudes-towards-cycling-2012-report.pdf (Accessed: 28 April 2022).
van Eldijk, J., Gil, J., Kuska, N. and Patro, R.S. (2020) ‘Missing links–Quantifying barrier effects of transport infrastructure on local accessibility’, Transportation Research Part D: Transport and Environment, 85, p. 102410. Available at: http://doi.org/10.1016/j.trd.2020.102410
Van Rossum, G. and Drake, F.L Jr.. (1995) Python reference manual, Centrum voor Wiskunde en Informatica Amsterdam.
Vitale Brovarone, E. and Cotella, G. (2020). Improving rural accessibility: A multilayer approach. Sustainability, 12(7), p.2876. Available at: http://doi.org/10.3390/su12072876
Vybornova, A., Cunha, T., Gühnemann, A. and Szell, M. (2022) ‘Automated detection of missing links in bicycle networks’, Geographical Analysis, 55(2) pp. 239–267. Available at: http://doi.org/10.1111/gean.12324
Wasserman, D., Rixey, A., Zhou, X. (Elynor), Levitt, D. and Benjamin, M. (2019) ‘Evaluating OpenStreetMap’s Performance Potential for Level of Traffic Stress Analysis’, Transportation Research Record, 2673(4), pp. 284–294. Available at: http://doi.org/10.1177/0361198119836772
Wheels for Wellbeing (2021) Report of 2021 National Survey Results. Available at: https://wheelsforwellbeing.org.uk/wp-content/uploads/2022/05/Disability-and-Cycling-Report-of-2021-national-survey-results.pdf. (Accessed: 07 May 2024).
Wheels for Wellbeing (2022) Infrastructure for All. Available at: https://wheelsforwellbeing.org.uk/campaigning/infrastructure-for-all/ (Accessed: 23 April 2022).