1. Introduction
Parking, sidewalk riding, and vandalism are typically the greatest sources of public conflict and contention for shared e-scooter programs (Gössling, 2020; Portland Bureau of Transportation, 2019). Poor parking and sidewalk riding are valid causes for concern, as both can endanger pedestrians and pose a nuisance, particularly for people with mobility impairments. Research finds that rates of noncompliant parking by scooters (violating at least one local parking regulation) range from 8% to 33% (Fang et al., 2018; James et al., 2019; Portland Bureau of Transportation, 2019; Seattle Department of Transportation, 2019a; Seattle Department of Transportation, 2019b; Seattle Department of Transportation, 2019c). Some of the observed variation in parking noncompliance likely stems from local parking regulations, which vary from city to city. Recognizing local variation, a parking metric that can be more readily compared across cities is whether a scooter impedes access for pedestrians by blocking the sidewalk, curb ramp, or other pedestrian access points. A study of five US cities found, for example, that just 1.7% of parked scooters impeded pedestrian access (Brown et al., 2020), on a par with or slightly lower than in earlier studies (Fang et al., 2018; James et al., 2019; Portland Bureau of Transportation, 2019; Seattle Department of Transportation, 2019a; Seattle Department of Transportation,2019b; Seattle Department of Transportation, 2019c).
Cities’ experiences with shared scooters are short, and both the understanding of parking problems and the best approaches to address noncompliant parking are evolving. Understanding fundamental facts about scooters—including rates of noncompliant parking—is critical to ensuring appropriate approaches to regulation of shared scooter programs and developing suitable methods to curb negative impacts. In a context where shared scooters are mainly provided by private companies, parking policy is an example where urban planners and other policy makers must “continually (re)negotiate the state-market relation” to ensure the mobility benefits of shared scooters (Field and Jon, 2021, p369).
We ask three questions: How can cities and scooter companies reduce noncompliant parking? Do our observed measures of noncompliant parking match public perceptions? And what counts as noncompliant parking to the public? We answer these questions through two studies that we conducted in Auckland, New Zealand, and Washington, DC (hereafter “DC”).
In the first study, we examined how scooter riders responded to three interventions designed to reduce noncompliant scooter parking. The interventions consisted of (1) in-app messages to educate and remind riders of parking rules, (2) sidewalk decals directing riders to nearby parking corrals, and (3) physical locks so scooters can be secured to bicycle racks and other parking infrastructure. Using field data collected over several weeks, we evaluated the relative effectiveness of each of these interventions in reducing rates of noncompliance. We complemented the observational study with a second study focused on public perceptions of improper scooter parking. We used intercept surveys conducted in Auckland and DC to compare our observed rates of noncompliant scooter parking with public responses to probe the public’s understanding of scooter parking.
Though it is unusual to include two distinct studies in a single paper, the findings from the two studies complement and enrich each other. The observational study provides objective data about the frequency of noncompliant parking and points toward policies to mitigate this issue. But we have reason to believe that the observational data does not match the public’s perceptions of improper scooter parking. In our earlier field study of scooter parking, we observed low rates of scooters impeding pedestrian access (Brown et al., 2020). Yet, when we presented our findings to transportation professionals, we found that our audiences believed that rates of noncompliant scooter parking were much higher. By combining these two studies in one article, we hope to understand the source of the disconnect between what we observe on the ground and what people believe.
The following section summarizes the scholarly and gray literature on scooter parking. We then present the methods and findings from the first study and the second study in sequence. We conclude with a general discussion that ties the two studies together and offers suggestions for policy.
2. Scooter Parking
In this paper, we use three main terms to describe scooter parking behaviors. The first two terms, noncompliant parking and improper parking, warrant particular attention. Noncompliant parking describes scooter parking that runs afoul of local parking regulations. Improper parking refers to what people perceive as noncompliant parking. The terms are related but distinct. Scooters can be parked in ways that are both noncompliant and improper, neither, or one but not the other. Later in the paper, we will share examples that fall into each category. The third term we use frequently in this paper is impeding access, which refers to scooters that make it difficult for pedestrians, particularly those with mobility impairments, to pass.
2.1 Perceptions of scooter parking
Studies of shared micromobility media coverage suggest that scooter parking behaviors are a common concern. Gössling (2020) identified themes of clutter/parking, safety, irresponsible riding, and vandalism as the most frequently reported in ten global cities. Caspi and Smart (2022) found that US news outlets focused on three themes: conflicts between riders and pedestrians, scooter regulations for riding and operating, and safety concerns. Gössling (2020) concludes that commonsense regulations, such as limits on the number of operators, speed limits, the introduction of designated parking infrastructure, and educational campaigns, could limit negative outcomes, media coverage, and public perceptions.
Researchers have also surveyed riders to understand scooter parking. Multiple surveys have found that parking rules are not well understood (Buehler et al., 2021; James et al., 2019), perhaps partly due to their confusing, nonintuitive nature. Brown, Klein, and Thigpen (2021) surveyed Lime riders in five international cities about their knowledge of parking regulations and reasons for noncompliant parking. Most riders were motivated to properly park out of concerns about other travelers, and most cited a lack of understanding of the rules as a justification for noncompliant parking. The authors also found that riders perceived improper parking as impeding access for others, regardless of local parking regulations, suggesting that policy makers could improve parking compliance with education campaigns and by simplifying parking regulations to align more closely with riders’ concerns and intuitions (Brown, Klein and Thigpen, 2021). Others have found that perceptions of scooter parking varied dramatically between riders and nonriders. Several studies have found that nonriders are significantly more likely than riders to report encountering sidewalks frequently blocked by scooters (Buehler et al., 2021; City of Santa Monica, 2019; James et al., 2019).
Scooters are not the first disruptive mode to cause parking consternation. The advent of automobiles spurred new parking solutions: garages, on-street parking metering, and other measures (James et al., 2019). Aldred and Jungnickel (2013) found that before scooters ever arrived on city streets, the public found parked bikes to be “out of place,” threatening and threatened, risky, and at-risk. The authors observe a divergent approach to regulating bike versus car parking: in 2012, UK regulators banned towing or clamping a motor vehicle on private land but continued to allow immobilizing or moving a bike, despite cars more frequently obstructing rights-of-way compared to bikes (Aldred and Jungnickel, 2013).
2.2 Improving scooter parking compliance
Cities have adopted three main approaches to shared scooter parking: regulations, incentives, and infrastructure. Across all three approaches, cities have sought to enforce proper parking through shared micromobility companies’ digital platforms and traditional approaches (e.g., ticketing).
Parking regulations for scooters vary substantially across different cities: what is permitted in one city may be prohibited in another. Some regulations are common, such as the requirement for users to park scooters upright. Other regulations are more parochial; only one-third of US cities prohibit parking on vegetation or landscaping, in part to reduce the likelihood of a parked scooter falling down on an uneven surface (Brown, 2021). Cities also differ in permitting versus prohibiting shared scooter parking at bike racks and corrals—existing infrastructure already designated for micromobility vehicles. Twenty-two percent of US cities explicitly prohibit scooters from parking at bike racks or corrals, while others enforce even more nuanced regulations that allow scooters to park at public bike racks but not bikeshare stations (Brown, 2021).
Beyond rules and regulations, cities are also exploring approaches to encourage parking compliance. For example, many cities have installed designated scooter parking corrals, which take various shapes and sizes, on streets and sidewalks. A recent before-and-after study in Oslo and Trondheim, Norway, analyzed the effect of adding scooter parking racks and painted corrals on public rights-of-way (Karlsen et al., 2021). Using video data, GPS data, and surveys, the team found that undesirable parking decreased after the racks and corrals were installed, though the public perception of parking did not change significantly. Some companies also offer monetary incentives to encourage riders to use designated parking spaces. In Santa Monica, California, Lyft discounts compliant rides by $1 if riders park in certain geofenced zones, which are highlighted in green on the Lyft app (Brown, 2021).
The third approach to scooter parking is using vehicle design standards. Some cities have enacted vehicle lock-to requirements aimed at encouraging proper parking. As of October 2021, just four US cities (Chicago, Minneapolis, San Francisco, and DC) had imposed lock-to requirements (Brown, 2021), and examples in other countries are similarly rare. Cities tout successes with lock-to requirements reducing public complaints about scooter parking (Chicago Department of Transportation, 2021; San Francisco Municipal Transportation Agency, 2021), although research finds equally low rates of scooters impeding access in cities without lock-to requirements (Brown et al., 2020).
Attempts to regulate micromobility parking compliance and enforcement via digital platforms met with mixed success. Dunn (2020) argues that the precision of GPS on micromobility vehicles may be useful for evaluating the distribution of vehicles at broad scales (e.g., across a city, within neighborhoods) but cannot be used at the scale of a sidewalk, where the difference between proper and improper scooter parking can come down to a few feet of sidewalk right-of-way.
3. Study 1—Scooter Parking Interventions
Cities across the globe are looking for ways to regulate scooter parking but have little guidance on what works. In this first study, we evaluated three common approaches intended to reduce rates of noncompliant parking in two cities. The first two interventions focus on rider education, given the difficulties previously described with digital enforcement approaches (Dunn, 2020): an in-app message to educate/remind riders about proper parking and sidewalk decals directing riders to nearby scooter parking corrals. Both methods have been deployed in cities around the world (e.g., sidewalk decals in Los Angeles; Brown, 2021). In DC, our data collection fortuitously coincided with the introduction of a new citywide regulation that scooter riders lock up their scooters after riding; we treated the new lock-to requirement as a third intervention. We used an experimental research design in which we compare baseline data collected prior to intervention to scooter parking observations following each of the three interventions.
3.1 Methods
We conducted field observations and experiments in Auckland and DC. We chose these cities for their relevance to peer cities, their long histories with shared micromobility, and the feasibility of collecting data during the ongoing COVID-19 pandemic. The cities were also the settings for previous research on scooter parking (Brown et al., 2020; Brown, Klein and Thigpen, 2021). To identify appropriate study sites, we asked for guidance from local transportation planners, micromobility company government relations and operations staff, and other stakeholders familiar with the local context. We sought streets with a voluntary (nonmandatory) micromobility parking corral and high user demand (trip origins and destinations). In Auckland, we observed scooter parking in two different study areas within the city’s central business district (centered on 125 Queen Street and 205 Queen Street); in DC, data collection focused on a single study area in the downtown periphery (centered on the intersection of 14th St NW and U St NW). Appendix A includes maps of the locations (Figure 8).
In each city, we conducted systematic field observations of all parked shared scooters; we recorded scooters across multiple private operators but did not record personally owned scooters. We collected data in Auckland in April and May 2021 and in DC in September and October 2021. We hired research assistants to walk an assigned route within each study area over the following observation periods: Thursday, Friday, and Saturday from 11 am to 2 pm and 4 pm to 6 pm, weather permitting.1 We instructed the research assistants to collect data for each shared scooter they encountered on their routes. Our data collection instrument included an entry for the unique identification number associated with each shared micromobility device so we could later remove duplicate entries and avoid counting the same micromobility vehicle multiple times, a challenge in previous micromobility parking research (James et al., 2019). We trained all the research assistants with the same training presentation to foster consistent data collection practices and had them pilot the data collection methods ahead of the observation periods.
Our data collection instrument builds on previously developed methods used by Fang et al. (2018) and Brown et al. (2020).2 Research assistants filled out the instrument on their mobile devices while in the field using a Qualtrics form. The instrument included entries for the location of the scooter in the right-of-way (e.g., furniture zone, corral), micromobility company, if it was upright or knocked over, if it was parked parallel or angled relative to other adjacent scooters, if at least five feet in DC and three meters in Auckland (we used different distances in each city based on local regulations) of right-of-way remained passable, and if it impeded any pedestrian infrastructure (e.g., curb ramps, tactile dot pads). Research assistants also uploaded a photo of each observation, which we used to assess data quality and accuracy. The only variation in the instruments in Auckland and DC was the list of local micromobility companies, units of measurement (feet vs. meters), and information about whether a scooter was locked to another object. The latter reflects DC’s imposition of a scooter lock-to requirement midway through our data collection period, as described below.
3.1.1 Experimental treatments
Week 1: Baseline observations
Before conducting any experimental treatments, we collected baseline data to capture existing scooter parking behaviors across all shared scooter companies in operation. In each city, study areas included parking corrals, where riders could choose to park scooters but were not required to do so. Likewise, riders were permitted to park in the furniture zone (but not in bike racks in Auckland). In Auckland, some companies messaged simple in-app reminders to riders about local parking rules; by contrast, no such in-app message reminders were sent to riders in DC.
Week 2: In-app messaging
One week after collecting baseline condition observations, we implemented in-app messages for one scooter company: Lime. Implementing messaging for a single scooter company allows us to compare parking behaviors both against the baseline data and across riders who received targeted parking messages (Lime riders) versus those who did not (non-Lime riders). Figure 1 shows the in-app messages in Auckland, where the in-app message treatment represented a targeted adjustment to preexisting in-app message reminders. In DC, there was no existing in-app message. The in-app message was a new addition to the Lime rider experience and similar to the Auckland messages (but tailored to the local context). The in-app message reminders featured elements reinforcing why proper parking is important via imagery (a pedestrian using a white cane walking over tactile dots) and text (“Park properly for all Aucklanders”). The text also encouraged and reminded riders of how to park (“Please look for preferred parking zones”); by contrast, the preexisting messages in Auckland had focused on what not to do (previously, “Don’t block intersections” and “Don’t block the path”). The messaging was identical in both cities, with slight modifications to adapt for the local context (i.e., “Washingtonians” vs. “Aucklanders” and “sidewalk” vs. “footpath”).
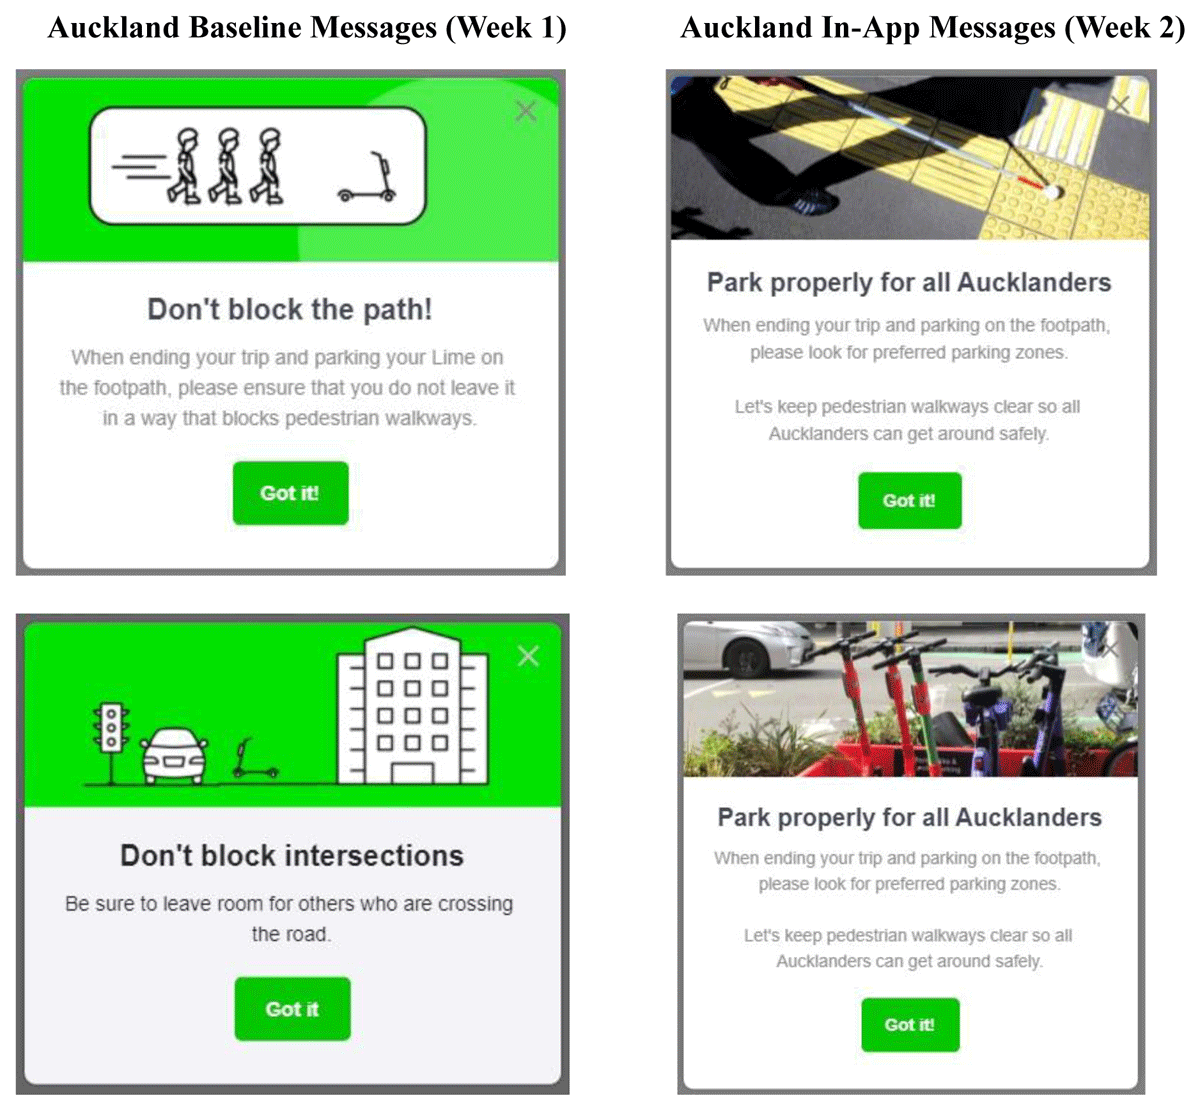
In-app messages in Auckland (week 2 intervention).
Week 3: Sidewalk decals
In the third week, we installed temporary sidewalk decals in each city’s study area and returned the in-app messages in the Lime app to the baseline state (i.e., reactivated the old in-app messaging in Auckland and removed in-app messaging in DC). The sidewalk decals were placed at about 330–660 feet (100–200 meters) from the focal parking corral sites (see Figure 2). The decal text encouraged riders to park in preferred parking locations (“Please lock up at a corral”), provided directions to the corral (a bright green arrow), and indicated the walking time to the corral (“30 seconds away” or “1 minute away”).
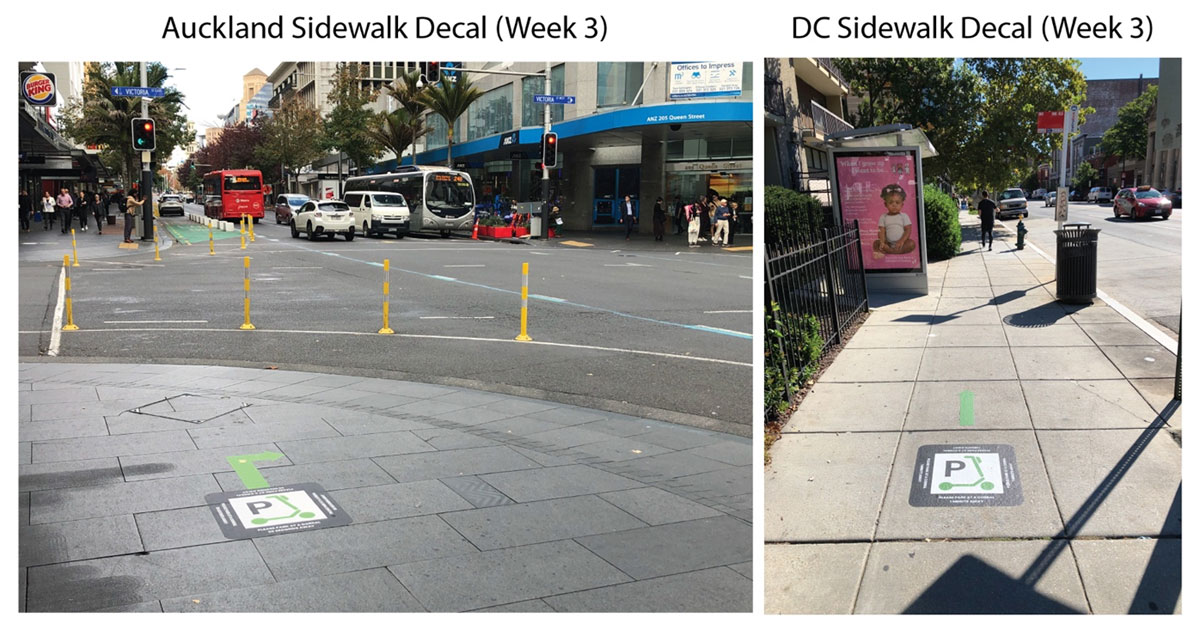
Sidewalk decals in Auckland and DC (week 3 intervention).
Week 4: Lock-to requirement
On October 1, 2021, DC began requiring all shared scooters to be equipped with locking mechanisms and that users lock the scooters to bike racks or other street furniture. We took advantage of this new requirement to evaluate how this new regulation affected scooter parking. To avoid collecting data while micromobility operators, riders, and the city alike were adjusting to the new parking regulation, we waited until the third weekend of October to collect field observations with the lock-to requirement in place (we conducted our observations for the baseline and first two treatments during the previous month). We also conducted two weeks of observations of the lock-to period to increase the sample size for this phase.
3.1.2 Limitations
Our findings correspond to the times and locations where we conducted observations. Although they have strong internal validity to identify whether experimental treatments were effective, they may not represent parking patterns in other times or places, even within the same city. As others have shown, aspects of the built environment can strongly influence parking compliance (James et al., 2019; Seattle Department of Transportation, 2019c). However, the consistency of our findings with previous literature suggests that this may not be a particularly concerning limitation.
The in-app message was shown only to Lime riders. It is possible that Lime riders differ from users of other shared scooter services. However, scooter companies generally charge similar prices and offer comparable vehicle models, leading to relatively small differentiation. Likewise, riders tend to choose which scooter they will ride based on availability rather than strong brand preference. We therefore suggest that differences in behavior across different shared scooter companies are likely to be minimal.
In September 2021, local TV and print outlets in DC reported on the coming regulatory changes that would require riders to physically lock scooters to bike racks (see, for example, Lazo, 2021; Wiggins and Zauzmer Weil, 2021; Witley, 2021). It is possible that this reporting changed some riders’ parking behavior during the baseline and first two experimental periods, though coverage was consistent throughout the month (e.g., early September coverage in the Washington Post as well as late September coverage in the Post, on a local TV news station, and in other local news outlets), suggesting that it is unlikely to have affected only a subset of the observation periods. More importantly, locks were not added to scooters until October 1, meaning riders could not have locked their scooters during September.
Finally, our findings are limited to examining the effects across three policy interventions: we are not able to infer the potential efficacy of other parking-oriented policies that cities have also enacted, such as no-parking zones and providing discounts for trips that end in preferred parking areas.
3.2 Findings
In this subsection, we describe how the three interventions affected scooter parking. Throughout our discussion, we focus on the rates of scooters parked out of compliance and scooters impeding access (Figure 3)3 and the location of parked scooters (Figure 4).
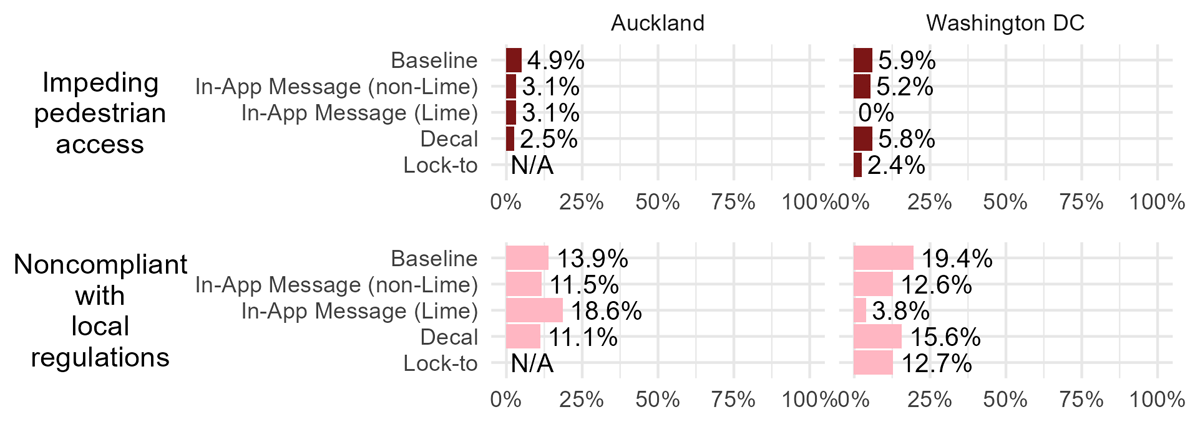
Noncompliant parking and impeding access across three policy interventions.
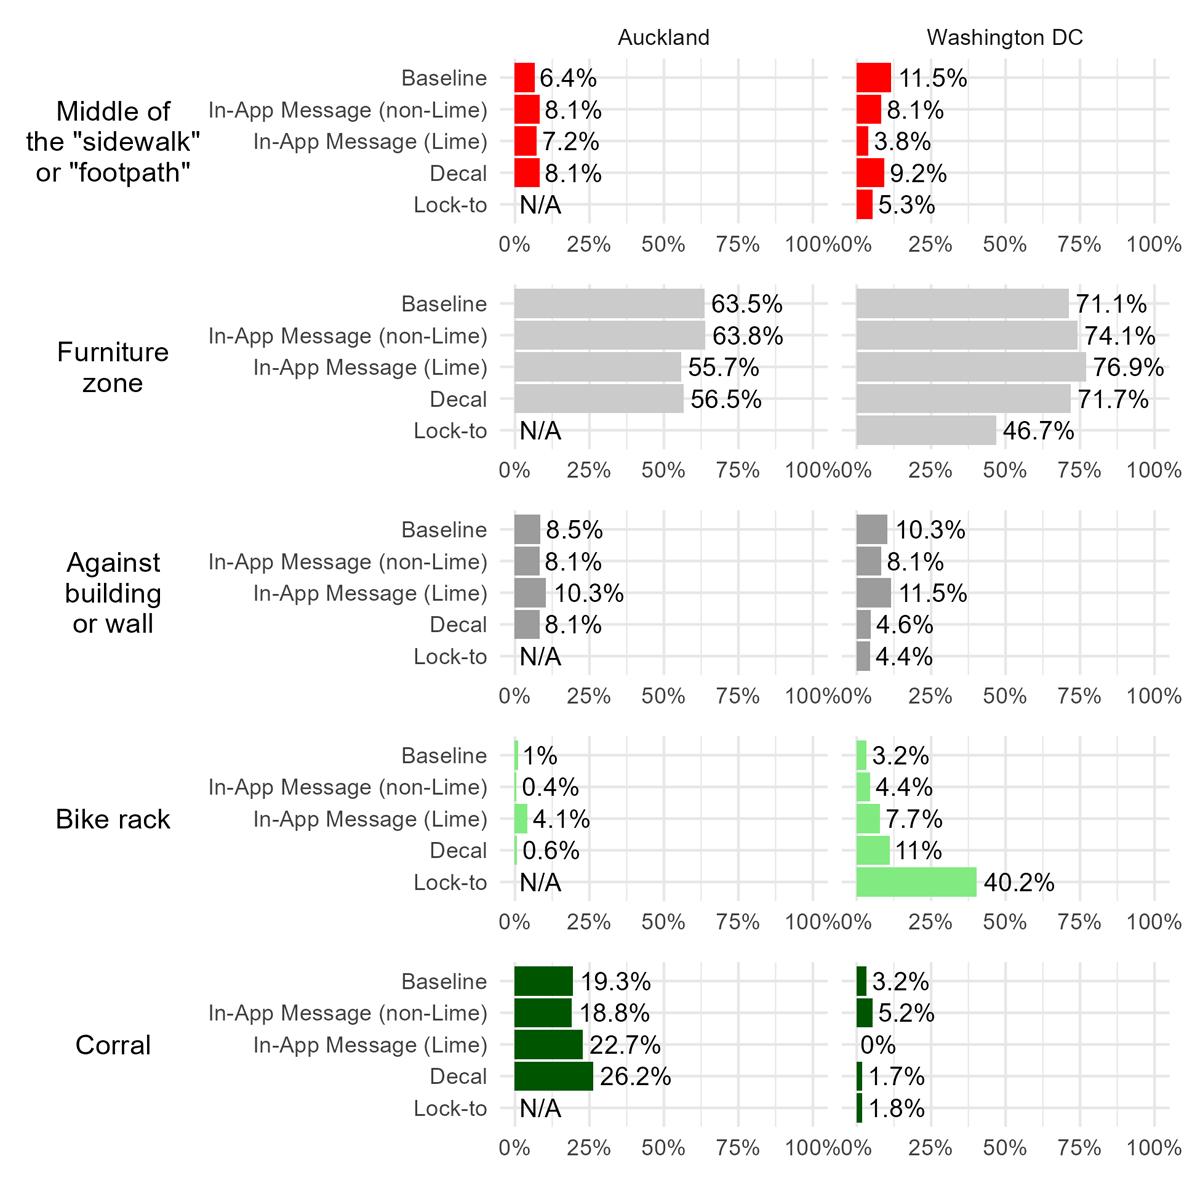
Scooter parking locations by intervention.
3.2.1 Baseline parking behaviors
Prior to the interventions, 5% to 6% of shared scooters impeded pedestrian access in both cities, consistent with previous research. A higher proportion—roughly one in six or five (15% or 19%)—of scooters violated local parking regulations. This estimate, however, is influenced by local parking rules, which vary by city (e.g., parking a shared scooter in a bike rack is banned in Auckland but not in DC).
In both cities, the most common parking location, by far, was the furniture zone (64%–71%). In Auckland, parking corrals were the second-most-common parking location (19%), while they were used infrequently in DC (3%). In DC, the second-most-common parking locations were the middle of the sidewalk (12%) and against a building (10%). Scooters were rarely parked at bicycle racks (1.5% in Auckland and 3% in DC).
3.2.2 In-app messages
We observed a weak response to the in-app message in Auckland and a somewhat larger improvement in parking compliance in DC. Unlike Auckland—which already had simple in-app message reminders about proper parking prior to the research intervention—DC had no in-app reminders at baseline. Therefore, in-app messages may improve parking compliance, though it may be the introduction of a reminder—rather than the use of specific wording or imagery—that sways behavior.
In Auckland, introducing refined versions of in-app message reminders for Lime riders led to only a slightly lower rate of shared scooters impeding access compared to baseline (4.9% to 3.1%; Fisher’s exact test: p > 0.05). Furthermore, rates of impeding access were similar for both Lime vehicles (whose riders received the message) and non-Lime vehicles (whose riders did not receive the message), suggesting that the reduction in impeding access was not attributable to the in-app message. The percentage of shared scooters that violated Auckland parking regulations increased for Lime scooters (14% to 19%; Fisher’s exact test: p > 0.05)—a counterintuitive result—but declined among non-Lime scooters relative to baseline observations.
After the introduction of in-app messages, noncompliant parking in DC declined from baseline for Lime scooters (19% to 3.8%; Fisher’s exact test: p < 0.05) but only slightly (19% to 13%) for other companies’ scooters. Likewise, the rate of shared scooters impeding access dropped from 5.9% to 0% for Lime scooters (though the sample size lacks sufficient power to identify a statistically significant effect; Fisher’s exact test: p > 0.05), while other companies’ vehicles continued to impede access at rates similar to the baseline (5.9% to 5.2%).
3.2.3 Sidewalk decals
The introduction of sidewalk decals did not lead to a statistically different rate of noncompliant parking or impeding pedestrian access in either city compared with the baseline. We did observe increased rates of parking in parking corrals and bike racks.
In Auckland, sidewalk decals had a small effect on parking behavior. The percentage of shared scooters that impeded access declined from 4.9% to 2.5% (Fisher’s exact test: p > 0.05), while the percentage of parked scooters noncompliant with local regulations fell from 14% to 11% (Fisher’s exact test: p > 0.05). The effect of decals on overall measures of parking compliance in DC was similarly minimal: impeding access stayed effectively constant (5.9% to 5.8%; Fisher’s exact test: p > 0.05), and noncompliant parking according to regulations dipped from 19% to 16% (Fisher’s exact test: p > 0.05).
The decals appeared to be effective at increasing parking in corrals in Auckland. The proportion of shared scooters parked in a corral increased from 19% to 26% in week three, a 26% increase (Fisher’s exact test: p < 0.05). In DC, corral parking decreased very slightly from already low rates, from 3.2% to 1.7% (Fisher’s exact test: p > 0.05), while bike rack parking increased from 3% to 11% (Fisher’s exact test: p < 0.005). This may be attributable to four complementary factors in DC. First, the nearby corrals are placed at a distance from the closest intersection, so they may have been difficult for riders to locate. Second, riders may not have been aware of what a parking corral was or what it looked like, and they may have thought the decal was referring to bike racks. Third, even if riders knew where the corral was, they may have been unwilling to walk to the corral when legal parking in the form of bicycle racks was closer and available. And finally, media coverage of the forthcoming implementation of lock-to requirements may have led riders to use bike racks rather than the corrals. It is also possible that some riders did not see or ignored the decals entirely, eliminating the treatment effects for some users.
3.2.4 Lock-to requirement
The lock-to requirement had a large effect on parking compliance and location. Following the implementation of the lock-to requirement in DC, the rate of parked scooters impeding pedestrian access decreased by over half (5.9% to 2.4%; Fisher’s exact test: p < 0.05), and we observed a robust one-third decrease in noncompliant parking (19% to 13%; Fisher’s exact test: p < 0.05).
We also observed major shifts in where shared scooters parked. Bike rack use increased more than twelvefold compared to baseline (3.2% to 40%; Fisher’s exact test: p < 0.001), fueled by sharp declines in parking in the furniture zone (71% to 47%; Fisher’s exact test: p < 0.001), parking against a building (10% to 4.4%; Fisher’s exact test: p < 0.005), and parking in the middle of the sidewalk (12% to 5.3%; Fisher’s exact test: p < 0.01).
3.3 Summary
The experiment yielded two key insights. First, rates of noncompliant scooter parking are low, but the actual rate of compliance greatly depends on local regulations. Second, while in-app messages and sidewalk decals can encourage marginal changes in parking behavior, the introduction of lock-to requirements had the greatest improvement in parking compliance and shift in parking locations.
4. Study 2—Perceptions of scooter parking
In our second study, we sought to understand perceptions of scooter parking by surveying members of the public. We focused on two questions: How much improper parking does the public think is happening? And what do respondents think counts as improper parking?
4.1 Methods
Research assistants in Auckland and DC conducted intercept surveys of pedestrians in the same study areas as described in Study 1. Research assistants invited participants to take the survey immediately by scanning a QR code and completing the survey on their smartphone or later on their smartphone or computer. In Auckland, 144 respondents started the survey, and 125 completed it; in DC, 71 people started, and 58 completed. Survey respondents were nearly evenly split between female (51%) and male (46%), were 31 years old on average, and overwhelmingly (92%) worked, lived, or went to school in the study city. The majority (60%) had never taken a trip on a shared scooter.
The survey focused on two topics. First, we asked respondents to estimate the share of scooters, bicycles, and cars that are improperly parked in the study city. Second, we assessed their perceptions of scooter parking by showing them only three randomly selected parking scenarios out of the ten scenarios (see Figure 6) and asked two questions about the images: “Does this scooter comply with the parking rules in [Auckland or DC]?” and “In your view, does this scooter clutter the street?” To avoid question nonresponse due to survey length, we only asked each respondents their perceptions about three of ten possible parking scenarios.4 Prior to collecting any data, we obtained approval from the first author’s Institutional Review Board.
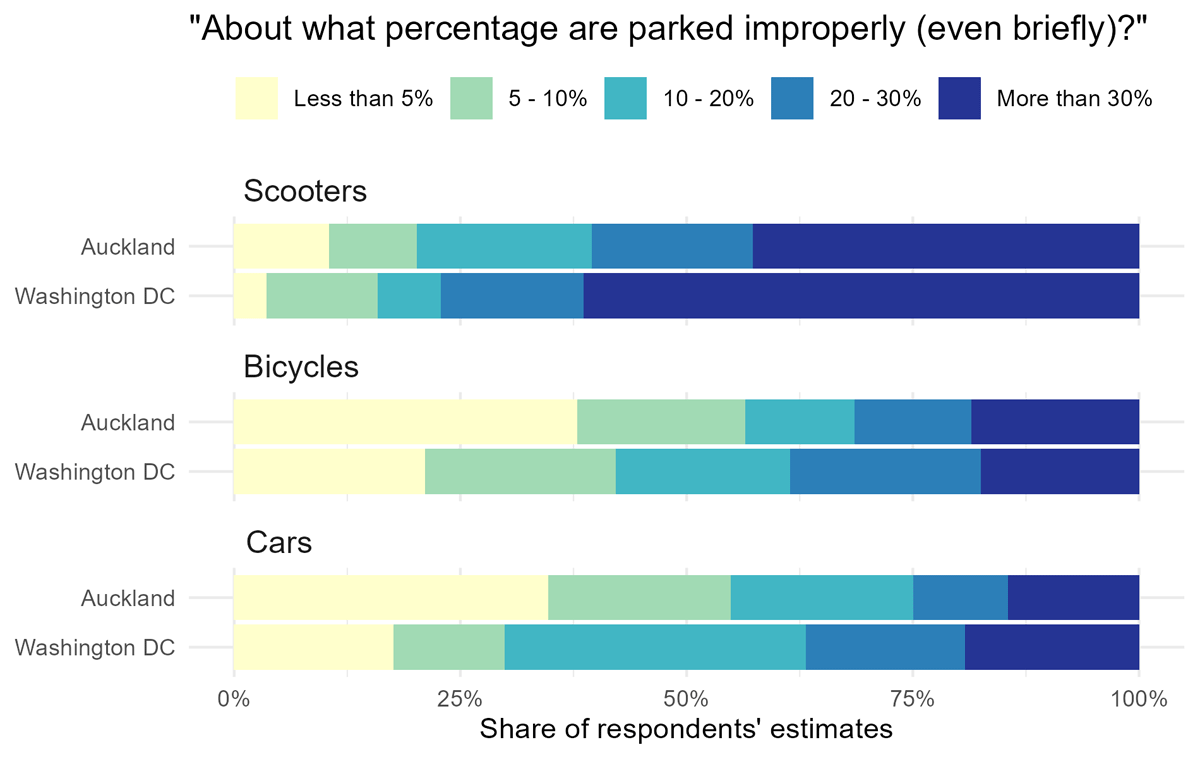
Estimates of improperly parked scooters in Auckland and Washington, DC.
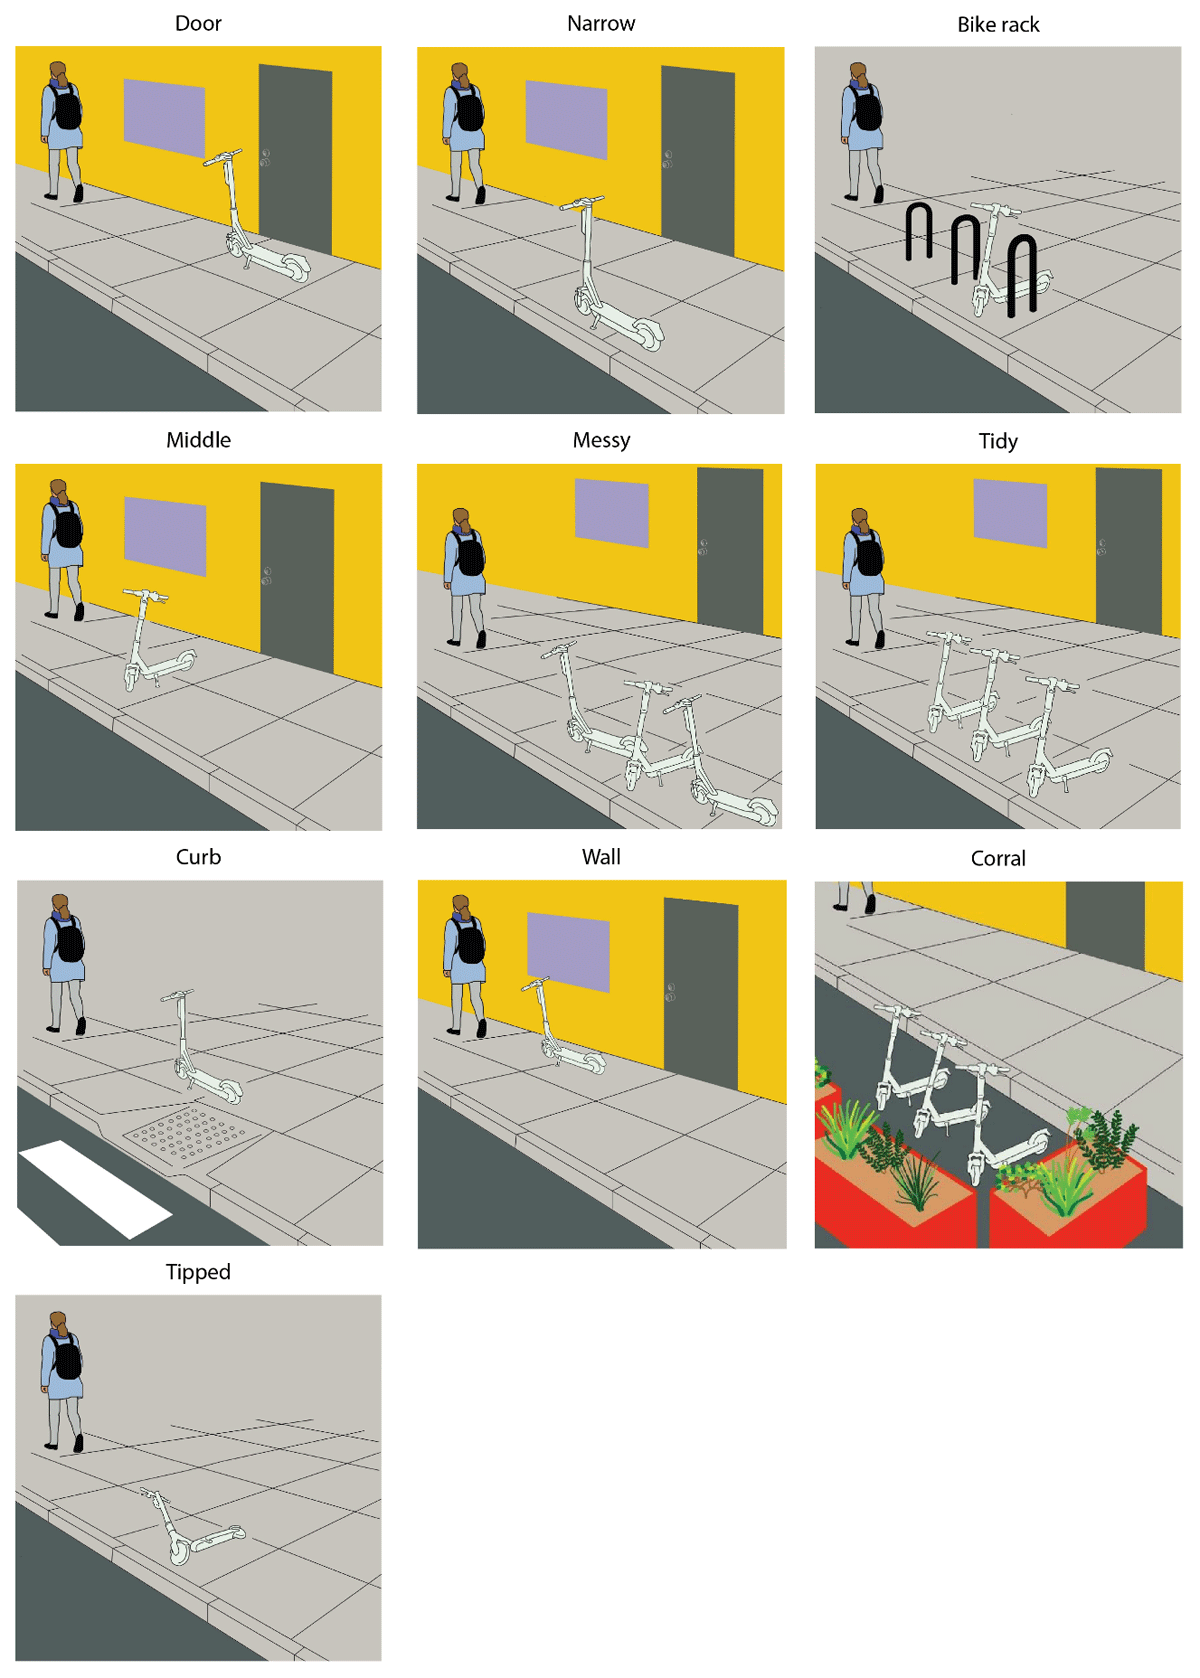
Scenarios displayed in survey to test knowledge of parking regulations and assess perceptions of clutter.
4.1.1 Limitations
Our survey samples are likely not representative of the public that has seen scooters parked in the two focal cities, but assessing the representativeness of the intercept survey is difficult. The relevant population of interest was individuals who live, work, or otherwise pass through the study areas in the two cities; the attributes of these populations are unknown. Approaches to identify a close match for the population (e.g., the Census statistics of those living in the study areas) for weighting would simply introduce additional uncertainty in our estimates, so we present unweighted survey results.
4.2 Findings
4.2.1 Perceptions of parking
Respondents overestimated the prevalence of improper scooter parking (Figure 5). In Auckland, the median estimate was that 20%–30% of scooters were improperly parked, compared with our observations that 15% of parked scooters did not comply with local regulations and 5% impeded access at baseline (and lower in subsequent weeks, when we continued to collect public perception data). In DC, the median estimate was that more than 30% of scooters are improperly parked, compared with 19% of scooters being noncompliant with local parking regulations and 6% impeding access at baseline (and lower in subsequent weeks).
Respondents also overestimated rates of noncompliant bicycle parking, but they said they believe it occurs less frequently than noncompliant scooter parking. The median response was that 5%–10% of bicycles are improperly parked;18% of respondents said more than 30% of bicycles are improperly parked, and 33% of respondents estimated that fewer than 5% of bikes are improperly parked. By contrast, previous studies suggest that fewer than 1% of bicycles impede pedestrian access (Brown et al., 2020).
While respondents overestimate improper scooter and bicycle parking relative to the published literature, they underestimate car parking violations. Brown et al. (2020) found that a quarter of all parked cars blocked access for other travelers in five US cities, yet only a small percentage of respondents (13%) estimated that 20%–30% of cars are parked improperly. The median respondent estimated that 10%–20% of cars are improperly parked.
We observe substantial variation in public estimates of improper scooter parking. This may reflect disagreement about what constitutes improper parking. Additionally, parking may be a low-salience issue that most respondents rarely think about and do not have a solid understanding or intuition of. Finally, the wide range of estimates could simply reflect innumeracy among the public (Paulos, 1988).
We also wanted to know whether public perceptions of improper scooter parking extend to the transportation professionals who regulate and manage shared scooter programs. To understand how public perceptions compared to those of transportation professionals, we also surveyed participants at four professional transportation conferences or meetings where one of the authors was presenting completed research on scooter parking. Transportation professionals held similar perceptions about rates of improper parking compared with intercepted survey respondents. The median transportation professional respondent reported that 20%–30% of scooters are parked improperly, compared with 10%–20% of bicycles and cars. We include more details about the survey of practitioners and findings in Appendix B.
4.2.2 What counts as improper parking?
To better understand the gap between public perceptions and field observations, we surveyed the public about its understanding of improper scooter parking using ten scenarios (Figure 6). We found that survey respondents appear to use two considerations in identifying whether a shared scooter is parked properly: pedestrian accessibility and visual clutter.
Response patterns showed clear evidence that pedestrian accessibility is a primary condition the public uses to assess proper parking. The overwhelming majority (85%–90%) of respondents assessed bike racks, parking corrals, and scooters neatly arranged in the furniture zone (“tidy” in Figure 7) as parked properly. In each of these three cases, there was plenty of sidewalk space for pedestrian access.
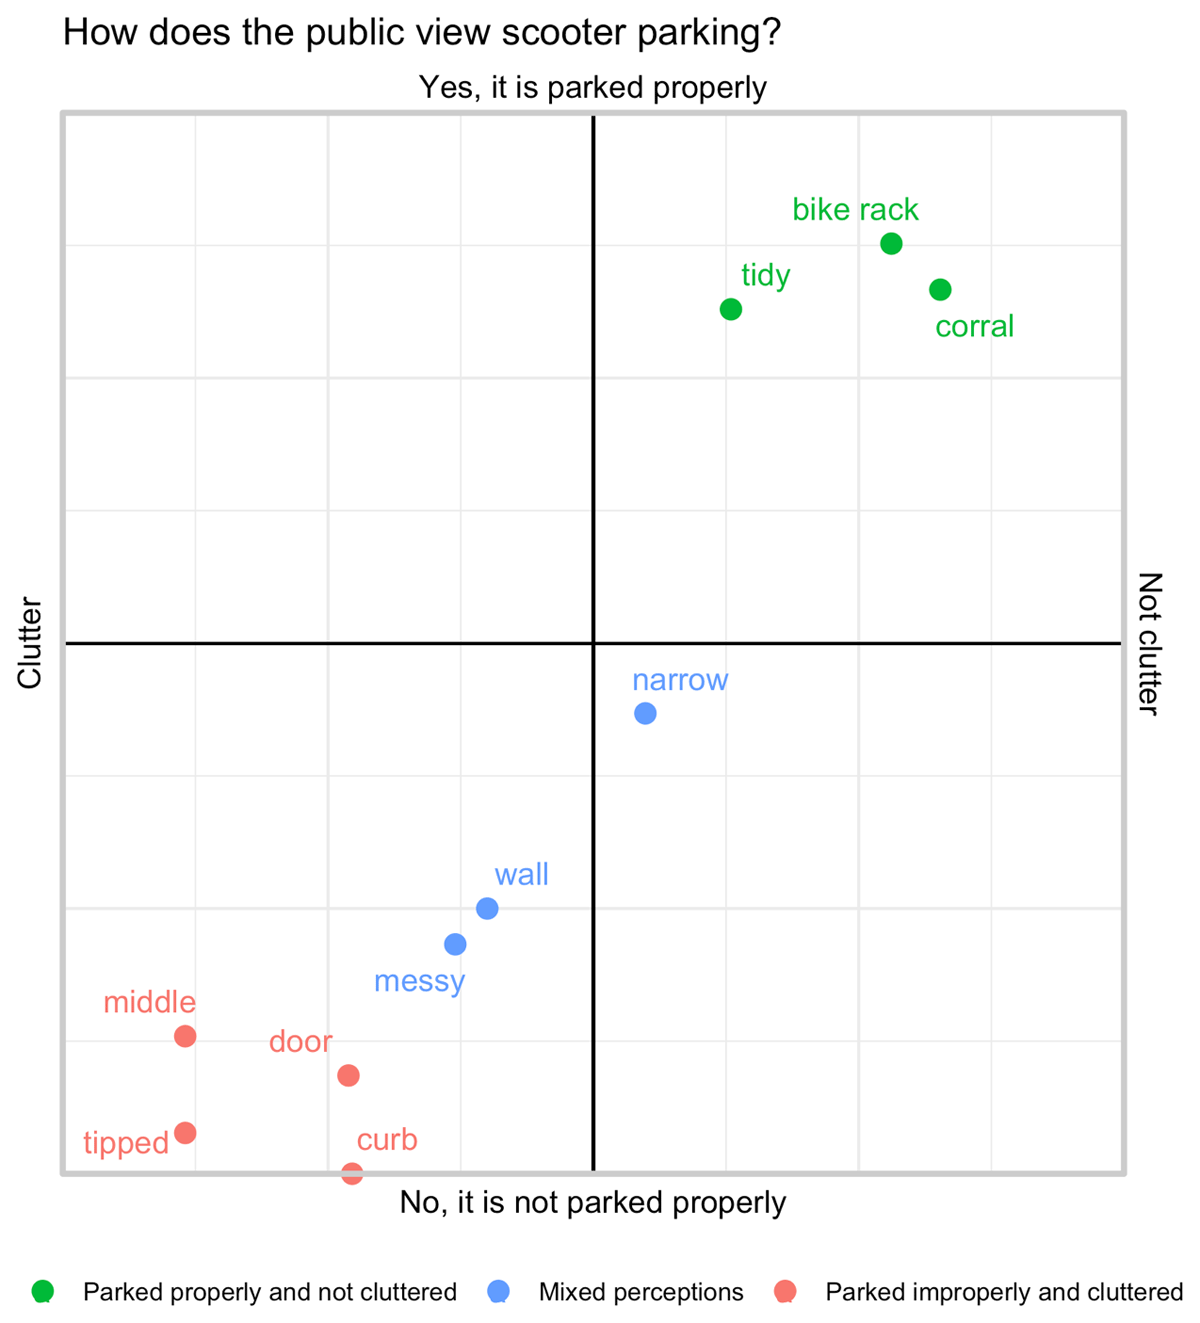
Perceptions of noncompliant parking and clutter for ten scooter parking scenarios.
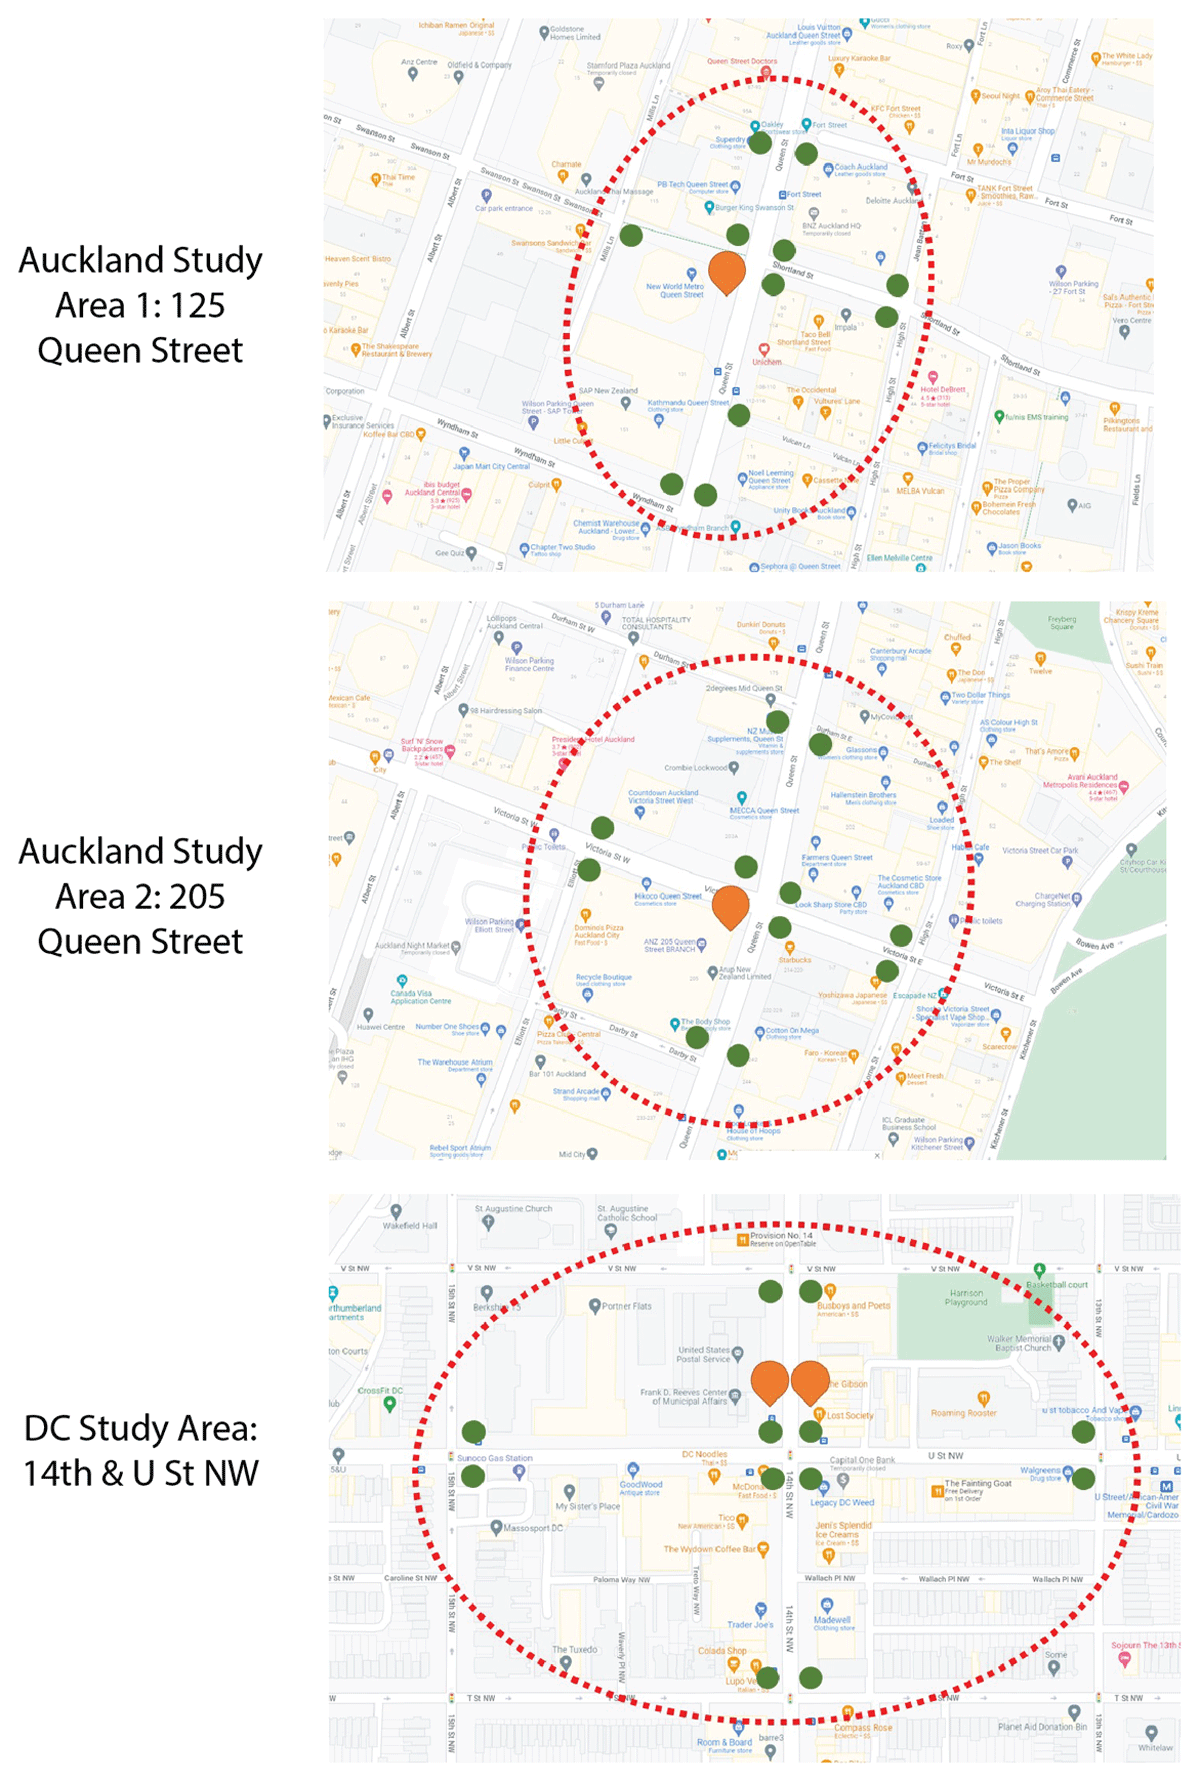
Study areas in Auckland and DC.
Conversely, the public decisively identified all four of the scenarios that may pose accessibility hazards—tipped-over scooters or scooters parked in front of a doorway, in front of a curb cut, or in the middle of the sidewalk—as noncompliant with local parking rules (85%–100% of respondents indicated the scooters in these scenarios were improperly parked).
The public appeared to conflate “tidiness” with proper scooter parking. We presented respondents with two similar scenarios where scooters were parked in the furniture zone of a wide sidewalk, with one scenario showing “tidy” scooter parking and the other “messy.” The tidy scenario has a wide sidewalk with three parked scooters neatly aligned parallel with one another in the furniture zone. The messy scenario shows the same three scooters on the same wide sidewalk but parked at different angles from one another (see Figure 6). Over 75% of respondents reported that the scooters in the tidy scenario were parked in compliance, while over 75% reported the non-parallel-parked scooters in the messy scenario as noncompliant with local regulations. A similar proportion also said the messy scooters were “cluttered.” The large differences in perceived parking compliance based on scooter orientation, combined with the relatively linear association between public perceptions of clutter and parking compliance (see Figure 7), suggest that the public may conflate tidiness with parking compliance.
4.3 Summary
Our survey results highlight a disconnect between the public’s perceptions of scooter parking and systematic field observations of scooter parking. The public’s perception of improper parking is an overestimate of the observed rate of noncompliant scooter parking, while at the same time, the public underestimates the rate of noncompliant car parking, relative to previous research (see Brown et al., 2020).
Furthermore, we identified two key considerations determining the public’s perception of improper scooter parking. First, the public clearly identifies pedestrian access as a crucial determinant of compliant parking. Second, the public strongly considers tidiness when gauging proper versus improper parking. A simple manipulation of one parking scenario to alter the orientation of parked scooters relative to one another into either tidy or messy configurations produced dramatic swings in public perceptions of scooter compliance and clutter. The importance the public places on tidiness in determining compliant parking may explain some of the public backlash against scooters, even when scooters are rarely parked in ways that violate local rules or impede travel by others. But scooters may offend people’s aesthetic sensibilities or pose a nuisance at times (e.g., a crowded sidewalk during peak rush hour).
5. Discussion
Improper scooter parking is one of the most common complaints about micromobility across the globe. We believe that this problem is widely misunderstood, which in turn distorts policy responses and distracts from much more important transportation problems.
We conducted two studies in Auckland, New Zealand, and Washington, DC, using field experiments and surveys. In our field experiments, we observed scooter parking and evaluated rates of noncompliant parking (measured as both impeded access and noncompliant parking according to local regulations) before and after several interventions. Our field experiments coincided with introducing a lock-to requirement for scooters in DC, allowing us to analyze how this new regulation shifted scooter parking behaviors.
People overestimate rates of improper scooter parking relative to the share of scooters that we observe violating local regulations or impeding access by other travelers. Perceptions of rampant improper parking are pervasive, and even riders themselves think that many or most other riders are bad actors (Brown, Klein and Thigpen, 2021). Practitioners are no better than the public in assessing rates of noncompliant scooter parking (see Appendix B).
Planning and policy discussions about scooter parking need to start from a place of shared understanding—namely, what counts as improper parking. We find that public perceptions of improper parking are largely driven by concerns about pedestrian accessibility and an aesthetic sense of tidiness and order. Simply varying the orientation of parked scooters in our survey scenarios flipped public perceptions of the scooters from tidy and compliant to cluttered and noncompliant. The appearance of “clutter,” when riders do not park their scooters in a tidy fashion, may lead to higher perceived noncompliance than occurs when judged by local regulations or impedance.
We can test our hypothesis that perceptions of improper parking are shaped by concerns about pedestrian accessibility and aesthetic concerns. In DC, we recorded whether groups of scooters were parked in parallel to each other (as depicted in the “tidy” scenario of our survey) or with some scooters at an angle to others (i.e., nonparallel, as depicted in the “messy” scenario of our survey). Using this data, we developed adjusted parking metrics where we reclassified any non-parallel-parked scooters as noncompliant parking and impeding access (even if they were correctly parked by local regulations and not impeding pedestrian access). Across all experimental phases in DC, we originally observed that 4% of parked scooters impeded access and 15% were noncompliant with local regulations. When we counted nonparallel parking as an infraction, however, the adjusted rate of impeding access jumped to 24%, and the adjusted rate of noncompliant parking soared to 32%. This latter adjusted rate of noncompliant parking is similar to survey respondents’ estimates of improper scooter parking in DC, suggesting that accessibility and aesthetics together shape public perceptions of the prevalence of improper parking.
Public perceptions are important in both shaping the narrative around scooter parking and influencing the policies that govern scooter parking. A dissatisfied public can engage in policy debate by writing to elected officials, submitting public comment at city council meetings, and complaining to city agencies that oversee shared micromobility services. Complaints and concerns may shape subsequent policy measures, professionals’ perceived salience of different issues, or both. Indeed, we find that transportation professionals’ views mirror the public’s and that many greatly overestimate rates of improper scooter parking, which could affect the types of scooter regulations that cities enact.
Each policy intervention we tested improved scooter parking compliance, but to differing degrees. Implementing in-app messages and installing sidewalk decals led to small but meaningful improvements in noncompliant parking and impeding access, and DC’s citywide lock-to requirement dramatically improved scooter parking compliance. Yet, this latter requirement is not without potential conflicts. City staff often cite bicyclist complaints and concerns that scooters will consume all existing bike rack spaces if allowed or required to park on lock-to racks (Brown, 2021). We assessed whether these fears were borne out in our study area in DC. Before DC implemented lock-to, the greatest number of scooters parked at a bike rack within a given observation day was eight (6% of available rack space within the study area). While the number of scooters parked at racks dramatically increased following the lock-to requirement, we estimated that the largest number of scooters parked at bike racks at any time was, at most, 38, or 30% of the total bike rack and parking corral capacity (space for 126 bicycles or scooters) within the study area. Beyond the areas studied here, the degree to which scooters may utilize (or monopolize) bike rack space will depend on how robust bicycle infrastructure is in a given city or location.
Scooter parking regulations vary from city to city and are, at times, at odds with public perceptions about what constitutes proper parking. Expecting riders to know the intricacies of scooter parking regulations (Brown, 2021), especially when they vary across places, is unrealistic. We recommend retaining regulations that align with public intuitions. For example, the public and most regulations already forbid scooters to block doors, impede others’ travel, or be left tipped over. However, our survey data suggests that scooter parking should be permitted in locations such as bike racks and parking corrals, where the majority of the public feel scooters are properly parked, where they do not impede access by other travelers, and where parking is consistent with other micromobility vehicles like bicycles.
To put it simply, we suggest making parking rules obvious and intuitive. Allowing scooter riders to use intuitive solutions as compliant parking is likely to have several related benefits, including reduced noncompliant parking and improved public perceptions. In Chicago, for example, the introduction of physical locks resulted in 97.3% compliance in parking audits and a dramatic reduction (78%) in complaints (Chicago Department of Transportation, 2021). We likewise find that the introduction of lock-to requirements in DC resulted in a twelvefold increase in bike rack parking and improved parking compliance.
Cities should provide more physical infrastructure to park micromobility vehicles, both shared and privately owned. One key advantage of physical infrastructure, such as bike racks and parking corrals, is that it communicates parking regulations to riders and the wider public, unlike digital-only solutions. Evidence shows that when cities provide scooter racks and parking corrals, people use them (Hemphill et al., 2022; Karlsen et al., 2021). These commonsense implementation measures can have additional benefits. Using scooter fees to pay for the installation of additional bike racks or on-street corral space, as some cities have done, ensures that riders of personally owned micromobility vehicles are not affected by shared scooters, and they may in fact benefit as well from the additional infrastructure (Lowe, Ashton and Kasal, 2021). This can help avoid conflicts between private and shared micromobility riders, and corral parking can also encourage riders to use the road rather than the sidewalk/footpath (Shah et al., 2021).
Micromobility operators can also improve parking compliance through rider education and communication. As this research showed, introducing a simple in-app message reminder can improve parking compliance where no message currently exists. Likewise, the introduction of signage, in this study in the form of a sidewalk/footpath decal, can improve parking compliance through further institutionalizing proper parking, as seen historically with the development of car parking signage. While results suggest that it may be challenging to eliminate all noncompliant parking, a combination of interventions can bring noncompliant parking down to even lower rates.
Finally, we urge policy makers to focus on straightforward, effective solutions rather than flashy technological fixes. Implementing parking regulations and enforcement through digital platforms are unlikely to work and only communicate rules to riders while remaining invisible to the public (Dunn, 2020). Further, riders may encounter difficulties cross-referencing rules presented on a digital map against their location in the cityscape, and they too would benefit from the “certainty” provided by physical infrastructure. Adorning shared scooters with a multitude of advanced technologies (e.g., expensive GPS units, cameras, automated reality, autonomous parking) is a distraction, especially when effective low-cost, tested solutions are already available.
Data Accessibility Statement
Data for this article are available at https://osf.io/2djz5/
Notes
- In the case of predicted rain or excessive heat, we shifted data collection to a Wednesday or Sunday or postponed it until the following weekend. ⮭
- We have made a version of the data collection instrument freely available online for others to use: https://forms.gle/c8xnSk75weKhxKLS9. ⮭
- In Auckland, a scooter violated local parking regulations if it was (a) parked in the middle of the footpath, (b) parked in a bike rack, (c) tipped over, (d) blocking an entrance to a building, (e) blocking a crosswalk, (f) parked such that a meter or less of footpath space remained to walk past the scooter, or (g) parked on a tactile dot pad. In Auckland, a scooter was determined to impede access if it was (a) blocking an entrance to a building, (b) blocking a crosswalk, or (c) parked such that a meter or less of footpath space remained to walk past the scooter. In DC, a scooter violated local parking regulations if it was (a) parked in the middle of the sidewalk, (b) tipped over, (c) blocking an entrance to a building, (d) blocking a crosswalk, (e) parked such that 3 feet or less of sidewalk space remained to walk past the scooter, or (f) parked on a tactile dot pad. In DC, a scooter was determined to impede access if it was (a) blocking an entrance to a building, (b) blocking a crosswalk, or (c) parked such that 32 inches or less of sidewalk space remained to walk past the scooter. ⮭
- The exact method changed slightly between the two cities. In Auckland, respondents were shown one image each from three scenario groups. The three groups were organized thematically: one group that we anticipated most respondents would rate as compliant and tidy, a second group of scenarios that respondents would rate as noncompliant and cluttered, and a third group that was mismatched—either compliant but cluttered or noncompliant but tidy. In DC, we showed respondents four images but did not organize them into thematic groups. We also showed respondents only one of the two randomly assigned questions (compliance or clutter) for all four images. We made this change to avoid biasing respondents to answer consistently for each image regarding the scenario’s compliance and clutter. We did not observe marked differences in responses in DC compared to Auckland and therefore feel confident in combining the two sets of responses despite the slight adjustment to the methods. ⮭
Appendix A
Appendix B
We compared public perceptions from the intercept surveys to the perceptions of transportation professionals, whom we surveyed during four webinars between February and October 2021 at which one of the authors was presenting completed research on scooter parking. These events were the International Parking and Mobility Institute (IPMI) conference (February 24, 2021); the Oregon Active Transportation Summit (OATS) conference (April 30, 2021); a Dublin, Ireland, webinar about scooter parking policy (July 15, 2021); and the North American Bikeshare & Scootershare Association (NABSA) conference (October 28, 2021). We collected responses from 158 respondents across the four events (85 at the IPMI conference, 31 at the OATS conference, 21 at the Dublin webinar, and 21 at the NABSA conference). We refer to these respondents as “practitioners” or “professionals,” though we acknowledge that we do not have information about their professional occupations.
We surveyed the audience at the start of our presentations. As the format was restricted in time and survey capability, we only asked what percent of scooters are improperly parked (all four events) and what percent of bicycles and cars are improperly parked (IPMI and NABSA only).
The polls we conducted during our webinars are convenience samples. We believe they include a broad cross-section of groups, including those focused on parking, on micromobility, and on active transportation, though we did not collect demographic or occupational information.
Practitioners’ estimates of improper scooter (Figure 9), bicycle, and car parking (Figure 10) are similar to those of the public. The median transportation professional said they think that 20% to 30% of scooters are improperly parked, and nearly half (46%) said that over 30% of scooters are improperly parked. In contrast, the median practitioner said a lower percentage of bicycles and cars (both 10%–20%) are improperly parked.
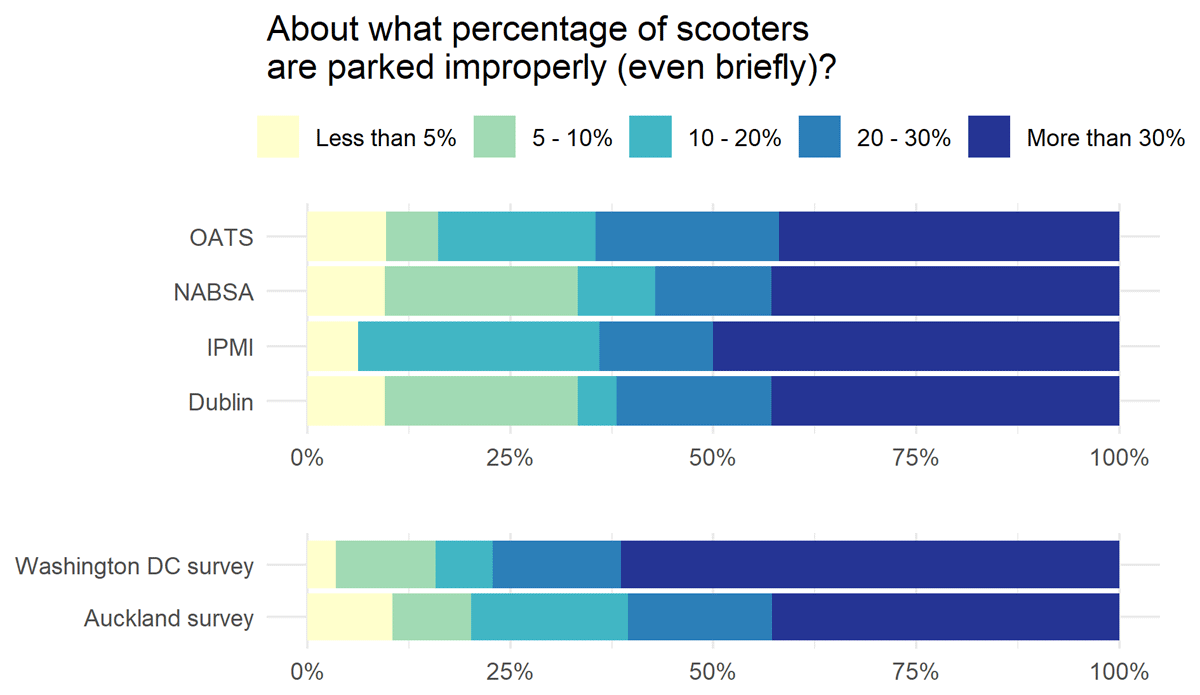
Estimates of improperly parked scooters by transportation professionals and the public.
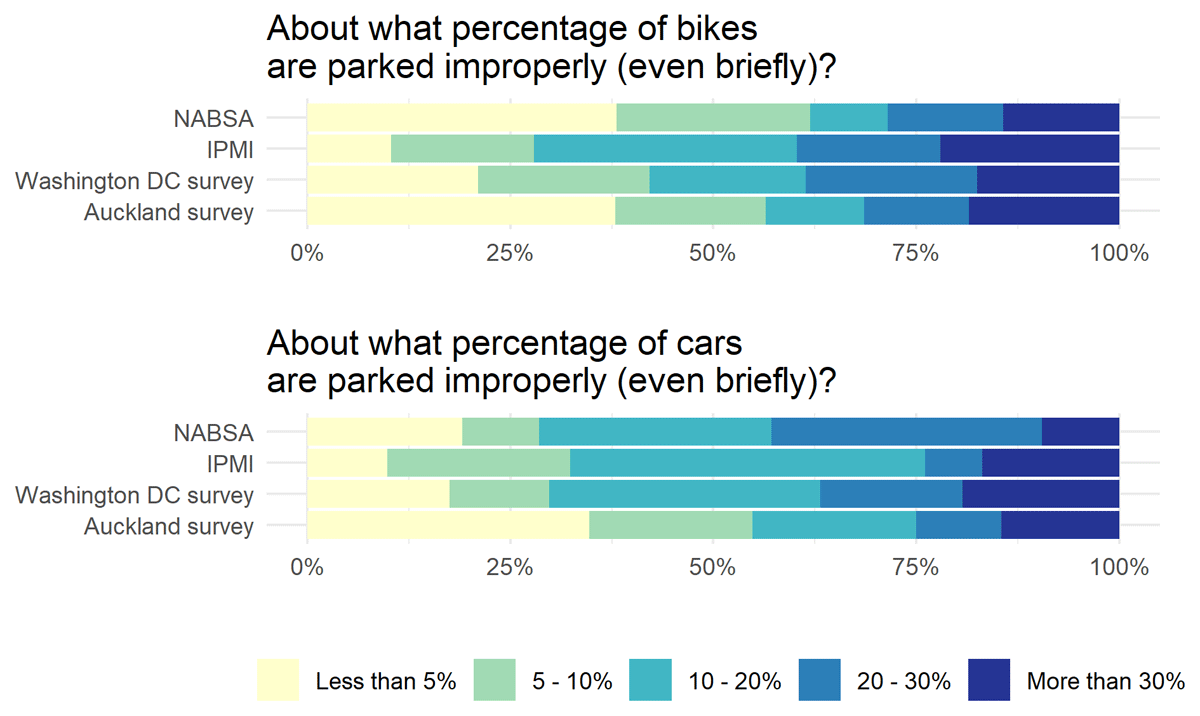
Estimates of improperly parked bicycles and cars by transportation professionals and the public.
Acknowledgements
Thank you to Na Zhou, Milad Jabbari, Rahul Kadam, Savitri Savitri, Julia Wicks, Benhaz Raouf, and Ugonna Njeze for their data collection efforts in Auckland and Washington, DC. Niki Dass, Lauren Mentjox, Robert Gardner, and Michael Kurlancheek of Lime and Sharada Strasmore, Greg Matlesky, and Javier Griffiths of DDOT helped with logistics, implementation, and study materials. Thank you as well to the organizers of the International Parking and Mobility Institute conference, the Oregon Active Transportation Summit, the Dublin webinar (Sebastian Schlebusch, Sarah Meade, Hannah Daly), and the North American Bikeshare & Scootershare Association for allowing us to survey attendees. We are also grateful to Joachim Scheiner, Giulio Mattioli, Dan Work, Caroline Janssen, and Subeh Chowdhury for reviewing various drafts of the survey and to Shari Shapiro, Ashley Scott, Sam Sadle, and Brandon Haydu for their support of this study.
Funding Information
Lime funded the research assistants, sidewalk decals, and incentives for the intercept survey.
Competing Interests
The authors have no competing interests to declare.
Author Contributions
The authors confirm contribution to the paper as follows: study conception and design, A. Brown, N. Klein, and C. Thigpen; data collection, A. Brown, N. Klein, and C. Thigpen; analysis and interpretation of results, A. Brown, N. Klein, and C. Thigpen; draft manuscript preparation, A. Brown, N. Klein, and C. Thigpen. All authors reviewed the results and approved the final version of the manuscript.
References
1 Aldred, R and Jungnickel, K. (2013). Matter in or out of place? Bicycle parking strategies and their effects on people, practices and places. Social & Cultural Geography, 14 (6), 604–624. DOI: http://doi.org/10.1080/14649365.2013.790993
2 Brown, A. (2021). Micromobility, macro goals: aligning scooter parking policy with broader city objectives. Transportation Research Interdisciplinary Perspectives, 12, 100508. DOI: http://doi.org/10.1016/j.trip.2021.100508
3 Brown, A, et al. (2020). Impeding access: the frequency and characteristics of improper scooter, bike, and car parking. Transportation Research Interdisciplinary Perspectives, 4, 100099. DOI: http://doi.org/10.1016/j.trip.2020.100099
4 Brown, A, Klein, NJ and Thigpen, C. (2021). Can you park your scooter there? Why scooter riders mispark and what to do about it. Findings. [Accessed 24 February 2021]. DOI: http://doi.org/10.32866/001c.19537
5 Buehler, R, et al. (2021). Changes in travel behavior, attitudes, and preferences among e-scooter riders and nonriders: first look at results from pre and post e-scooter system launch surveys at Virginia Tech. Transportation Research Record, 2675 (9), 335–345. DOI: http://doi.org/10.1177/03611981211002213
6 Caspi, O and Smart, MJ. (2022). Evaluation of e-scooter media coverage. Findings, 30193. DOI: http://doi.org/10.32866/001c.30193
7 Chicago Department of Transportation. (2021). 2020 e-scooter pilot evaluation. Available from https://www.chicago.gov/content/dam/city/depts/cdot/Misc/EScooters/2021/2020%20Chicago%20E-scooter%20Evaluation%20-%20Final.pdf.
8 City of Santa Monica. (2019). City of Santa Monica shared mobility device pilot program public survey results conducted 07–16–2019 to 08–02–2019. Available from https://www.smgov.net/uploadedFiles/Departments/PCD/Transportation/SharedMobilityReport_PublicSurvey_Final.pdf.
9 Dunn, PT. (2020). Participatory infrastructures: the politics of mobility platforms. Urban Planning, 5 (4), 335–346. DOI: http://doi.org/10.17645/up.v5i4.3483
10 Fang, K, et al. (2018). Where Do Riders Park Dockless, Shared Electric Scooters? Findings from San Jose, California. Mineta Transportation Institute. Available from https://transweb.sjsu.edu/sites/default/files/1713-WP2-Scooter-Parking.pdf.
11 Field, C and Jon, I. (2021). E-scooters: a new smart mobility option? The case of Brisbane, Australia. Planning Theory & Practice, 22 (3), 368–396. DOI: http://doi.org/10.1080/14649357.2021.1919746
12 Gössling, S. (2020). Integrating e-scooters in urban transportation: problems, policies, and the prospect of system change. Transportation Research Part D: Transport and Environment, 79, 102230. DOI: http://doi.org/10.1016/j.trd.2020.102230
13 Hemphill, R, et al. (2022). Congested sidewalks: the effects of the built environment on e-scooter parking compliance. Journal of Transport and Land Use, 15 (1), 481–495. DOI: http://doi.org/10.5198/jtlu.2022.2110
14 James, O, et al. (2019). Pedestrians and e-scooters: an initial look at e-scooter parking and perceptions by riders and non-riders. Sustainability, 11 (20), 5591. DOI: http://doi.org/10.3390/su11205591
15 Karlsen, K, et al. (2021). Parking solutions for shared e-scooters. Institute of Transport Economics, Norwegian Center for Transport Research. Available from https://www.toi.no/publications/parking-solutions-for-shared-e-scooters-article36746-29.html. [Accessed 15 July 2021].
16 Lazo, L. (2021). Scooter companies push back against proposed permit system in D.C. Washington Post, 3 September. Available from https://www.washingtonpost.com/transportation/2021/09/03/dc-scooter-operations-permit/ [Accessed 13 June 2022].
17 Lowe, K, Ashton, P and Kasal, Q. (2021). Taxing new mobility providers: report summary. University of Illinois Chicago, Government Finance Research Center. Available from https://gfrc.uic.edu/taxing-new-mobility-providers-2/ [Accessed 9 August 2021].
18 Paulos, JA. (1988). Innumeracy: mathematical illiteracy and its consequences. New York: Hill and Wang.
19 Portland Bureau of Transportation. (2019). 2018 e-scooter findings report. Available from https://www.portlandoregon.gov/transportation/article/709719 [Accessed 18 October 2018].
20 San Francisco Municipal Transportation Agency. (2021). Powered scooter share program. Available from https://www.sfmta.com/sites/default/files/reports-and-documents/2021/01/scooter_share_presentation_2021_permit_application_process_1.14.21_v2.pdf [Accessed 1 August 2021].
21 Seattle Department of Transportation. (2019a). 2019 Quarter 1 Bike Share Summary Report. https://www.seattle.gov/Documents/Departments/SDOT/BikeProgram/2019Q1_BikeShare_Summary_Report.pdf [Accessed 17 December 2019].
22 Seattle Department of Transportation. (2019b). 2019 Quarter 2 Bike Share Summary Report. https://www.seattle.gov/documents/Departments/SDOT/BikeProgram/2019Q2_BikeShare_Summary_Report.pdf [Accessed 17 December 2019].
23 Seattle Department of Transportation. (2019c). 2019 Quarter 3 Bike Share Summary Report. https://www.seattle.gov/Documents/Departments/SDOT/BikeProgram/2019Q3_BikeShare_Summary_Report.pdf [Accessed 17 December 2019].
24 Shah, NR, et al. (2021). Comparison of motor vehicle-involved e-scooter and bicycle crashes using standardized crash typology. Journal of Safety Research, 77, 217–228. DOI: http://doi.org/10.1016/j.jsr.2021.03.005
25 Wiggins, O and Zauzmer Weil, J. (2021). New laws taking effect Oct. 1: more access to police misconduct records, and you must lock your scooter. Washington Post, 30 September. Available from https://www.washingtonpost.com/local/maryland-dc-laws-police-misconduct/2021/09/30/67fc530c-1c82-11ec-8380-5fbadbc43ef8_story.html [Accessed 13 June 2022].
26 Witley, S. (2021). Scooter locks are coming to DC: here’s what you should know. NBC4 Washington, 23 September. Available from https://www.nbcwashington.com/news/local/scooter-locks-are-coming-to-dc-heres-what-you-should-know/2810168/ [Accessed 13 June 2022].